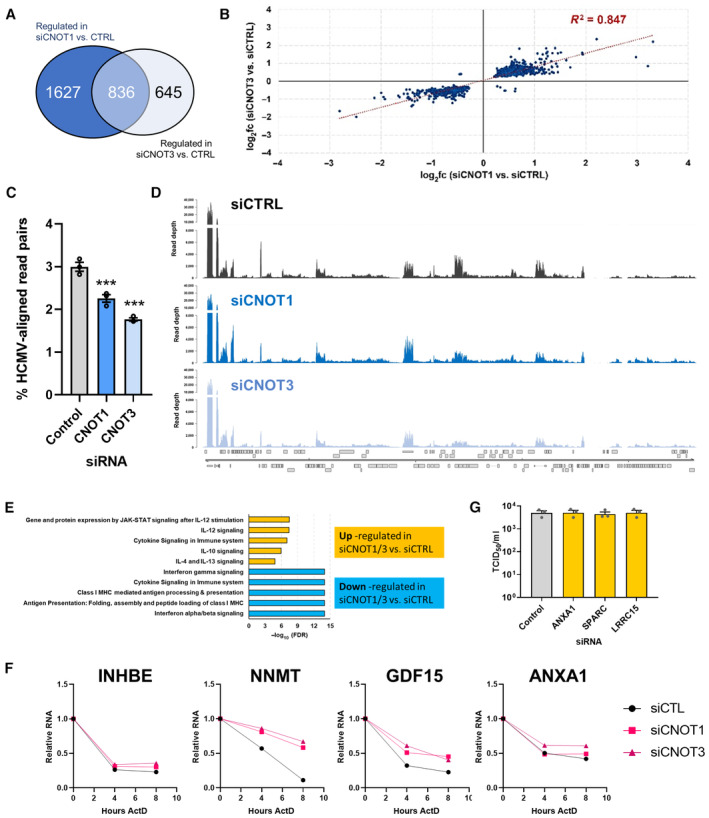
Figure 5. CNOT1 and CNOT3 depletion results in consistent host and viral transcriptome changes.

NHDFs were transfected with nonsilencing control siRNA, siCNOT1 (#1) or siCNOT3 (#1) and infected with HCMV AD169 at MOI = 3. At 72HPI RNA was isolated for Illumina RNA sequencing and transcriptomic analysis.
- Venn diagram showing the number of significantly (Padj < 0.05) differentially regulated genes in the comparisons between control siRNA‐ and either siCNOT1‐ or siCNOT3‐treated cells.
- Scatter plot depicting the log2 fold change vs. control for the 836 intersecting genes in the siCNOT1 and siCNOT3 datasets.
- Proportions of sequencing reads aligning to the HCMV strain AD169 reference genome (FJ527563.1) in samples treated with either nonsilencing control, CNOT1 or CNOT3 siRNAs plotted as mean ± SD from three biological replicates. (***) P < 0.001 by unpaired two‐tailed t‐test.
- RNA‐Seq coverage plots across the HCMV AD169 genome for nonsilencing control siRNA (siCTRL), siCNOT1, and siCNOT3 datasets. Each plot shows a representative sample of the three biological replicates with depth of coverage plotted on the y‐axis and genome position on the x‐axis. Canonical HCMV ORFs are shown as gray boxes.
- Pathway analysis of the 836 intersecting genes using the Reactome Pathway Browser (Jassal et al, 2020). Upregulated (n = 489) and downregulated (n = 347) were processed separately.
- mRNA decay of DEGs was monitored over 8 h actinomycin D treatment in control, CNOT1 (#1) and CNOT3 (#1) siRNA‐treated cells, normalized to GAPDH. Representative experiments of three biological replicates are shown.
- The effect of DEG‐depletion by siRNA on released infectious viral titer was determined by TCID50 from culture supernatants following 7d infection with AD169 at low MOI (0.05) of knockdown cells, plotted as the mean ± SEM (n = 3 biological replicates). No significant differences between control and DEG knockdowns were found by ANOVA test with Dunnett multiple comparison correction.
Source data are available online for this figure.
