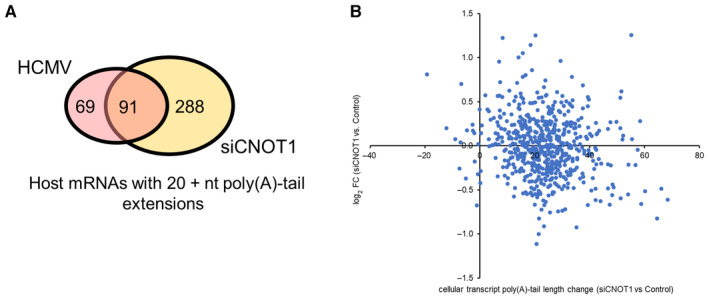
Figure EV5. Comparing poly(A)‐tail length changes and RNA abundance changes of cellular transcripts in CNOT1/3‐depleted and HCMV‐infected cells.

- Venn diagram showing overlap of host genes detected with > 20 reads for which ≥ 20 nt poly(A) tail length additions were found at any time point post‐infection (pink) compared to uninfected samples, and in siCNOT1 compared to siControl samples (yellow; average of two biological replicates).
