
Figure EV1. Crystal structure of Okp1‐Ame1‐Cse4END and flexibility at the Okp1‐Ame1 head‐coiled‐coil joint and Nkp1‐Nkp2 position.
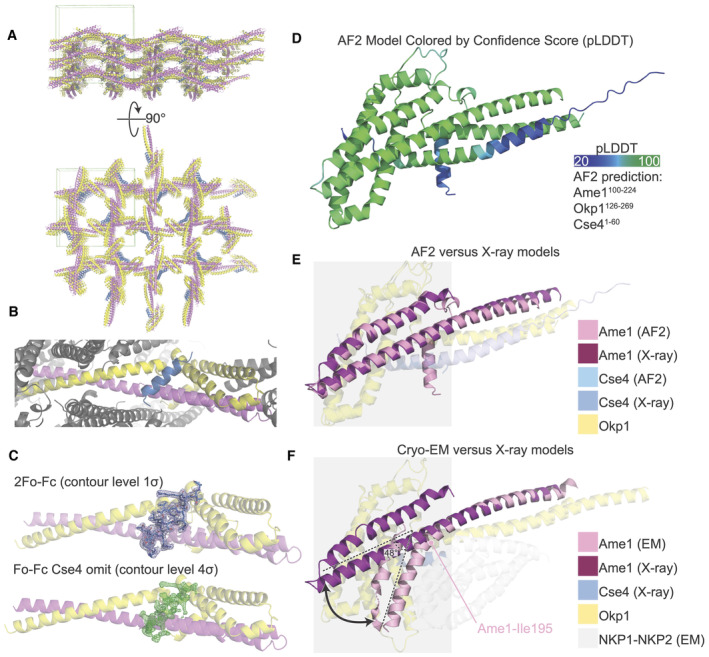
- The crystal structure of Okp1‐Ame1‐Cse4 colored as in Fig 1. The green box shows the limits of a single unit cell.
- Close‐up view of an individual biological protomer. Okp1‐Ame1‐Cse4 colored as in Fig 1. Neighboring protomers are colored gray.
- Cse4END peptide density from the final refined model (top; 2Fo‐Fc) and from the refined model lacking Cse4END (bottom; Fo‐Fc, Cse4 omitted).
- The structure of Okp1‐Ame1‐Cse4 as predicted by AlphaFold 2 (AF2) (Jumper et al, 2021). The model is colored according to confidence score (pLDDT) from low (blue) to high (green). The peptides used for prediction are given at right.
- Overlay of Okp1‐Ame1‐Cse4 from AF2 with the current Okp1‐Ame1‐Cse4 crystal structure (X‐ray). Only Ame1 (magenta and pink) is shown as an opaque chain for clarity. The gray box marks the Okp1‐Ame1 head domain.
- Overlay of the Okp1‐Ame1‐Cse4 structure from cryo‐EM (EM) with the current crystal structure. The angle between the head and coiled coil shaft is indicated for the cryo‐EM structure. Ame1‐Leu195, which is the position at which Ame1 bends in the cryo‐EM structure, is annotated. The Okp1‐Ame1 head domain is marked as in panel E. Structures were aligned on the Okp1‐Ame1 coiled coil shaft. The Nkp1‐Nkp2 structure from cryo‐EM (NKP12‐76; NKP24‐84) is shown as transparent gray chains.