Abstract
Chronic stress induces depression and insulin resistance, between which there is a bidirectional relationship. However, the mechanisms underlying this comorbidity remain unclear. White adipose tissue (WAT), innervated by sympathetic nerves, serves as a central node in the interorgan crosstalk through adipokines. Abnormal secretion of adipokines is involved in mood disorders and metabolic morbidities. We describe here a brain–sympathetic nerve–adipose circuit originating in the hypothalamic paraventricular nucleus (PVN) with a role in depression and insulin resistance induced by chronic stress. PVN neurons are labelled after inoculation of pseudorabies virus (PRV) into WAT and are activated under restraint stress. Chemogenetic manipulations suggest a role for the PVN in depression and insulin resistance. Chronic stress increases the sympathetic innervation of WAT and downregulates several antidepressant and insulin‐sensitizing adipokines, including leptin, adiponectin, Angptl4 and Sfrp5. Chronic activation of the PVN has similar effects. β‐adrenergic receptors translate sympathetic tone into an adipose response, inducing downregulation of those adipokines and depressive‐like behaviours and insulin resistance. We finally show that AP‐1 has a role in the regulation of adipokine expression under chronic stress.
Keywords: adipokines, depression, hypothalamic paraventricular nucleus (PVN), insulin resistance, sympathetic nerve
Subject Categories: Metabolism, Neuroscience
Under chronic stress, the PVN increases sympathetic innervation of adipose tissues and represses adipokine expression through AP‐1, which contributes to the development of depression and insulin resistance.

Introduction
Numerous studies show links between chronic stress and metabolic and neuropsychiatric disorders, including depression, anxiety, metabolic syndrome, hyperglycaemia, insulin resistance, diabetes mellitus type 2 (T2DM), cognitive dysfunction and hypertension (Chrousos, 2009; Joseph & Golden, 2017; Branyan et al, 2018; Kostov & Halacheva, 2018; Amadio et al, 2020; Price & Duman, 2020). Persistent stress results in organismal adaption failure and affects the vital organs such as the brain, heart and liver, in various aspects that increases susceptibility to psychiatric, cardiovascular, cognitive and metabolic disorders. The pathophysiology or pathogenesis of those diseases induced by chronic stress is mainly attributed to two pathways, the hypothalamic–pituitary–adrenal (HPA) axis and the sympathetic nervous system (SNS) axis (Dai et al, 2020; Lightman et al, 2020; Daniela et al, 2022).
Among these diseases related to chronic stress, depression and insulin resistance are major public health concerns worldwide, and numerous epidemiological studies have demonstrated a bidirectional association between depression and insulin resistance (Stuart & Baune, 2012; Moulton et al, 2015). Recently, research focusses on finding the shared biological pathways that may simultaneously predispose to both diseases, such as the HPA axis, autonomic dysfunction, poor dietary habits, environmental, economic and sociocultural risk factors, physical inactivity and sedentary lifestyle (Gangwisch, 2009; Stetler & Miller, 2011; Courtet & Olié, 2012; Holt et al, 2014; Mahar et al, 2014; Westfall et al, 2021; Wu et al, 2021). Such research may yield novel insights for the prevention and treatment of comorbid depression and insulin resistance. The HPA axis has been extensively studied regarding its effects on depression and insulin resistance during exposure to chronic stress, while the SNS has not been fully investigated, despite growing evidence suggesting its role in depression and insulin resistance (Pedersen, 2019; Prabhakar et al, 2020).
White adipose tissue (WAT), the most abundant adipose tissue and innervated by the SNS, serves as the primary organ for energy storage and responds to sympathetic activation to supply energy in conditions of cold or nutrient deprivation. WAT is also a major endocrine organ that secretes a diverse range of protein signals and factors termed adipokines. Some adipokines, such as leptin, adiponectin, resistin, visfatin, asprosin, Sfrp5 and Angptl4, are involved in modulating mood disorders and insulin resistance (Fasshauer & Blüher, 2015; Romere et al, 2016; Chen et al, 2018; Petersen & Shulman, 2018; Lee et al, 2019; Gonzalez‐Gil & Elizondo‐Montemayor, 2020; Sepandar et al, 2020; Yuan et al, 2020), indicating that dysfunctional WAT and dynamic changes in the expression of these adipokines under chronic stress may serve as a common pathogenesis for depression and insulin resistance.
The brain is the key organ in the orchestration of processing sensory information and coordinating behavioural and metabolic changes response to stress. It has been reported that several hypothalamic regions are critical in mediating the physiology and function of organs and tissues through the SNS responding to various stress. The ventromedial hypothalamic nuclei (VMH) mediates chronic stress‐induced bone loss through the SNS (Yang et al, 2020). The dorsomedial hypothalamic nuclei (DMH) contribute to the cardiac sustained elevated cardiac sympathetic tone and arrhythmias evoked by chronic stress (Fontes et al, 2014). Both the DMH and VMH play critical roles in the regulation of glucose and energy balance through sympathetic nerves innervating brown fat tissue (BAT; DiMicco et al, 2002; Dimicco & Zaretsky, 2007; Choi et al, 2013). The hypothalamic paraventricular nucleus (PVN) projects directly to spinal autonomic regions and serves a primary role in integrating the autonomic and endocrine response to stress (Jiang et al, 2019). Cardoso et al's study has shown that the PVN is involved in the regulation of adipose tissue metabolism through the SNS (Cardoso et al, 2021). Therefore, we hypothesized that dysfunction of a presumptive brain–adipose circuit, the PVN–sympathetic–adipose pathway, may be involved in dysfunctional WAT endocrine, and subsequent depressive‐like behaviours and insulin resistance, under chronic stress.
To address this hypothesis, we first performed retrograde polysynaptic pseudorabies virus (PRV) tracing, combined with c‐Fos immunostaining, in restraint stress‐treated mice to show that a subset of PVN neurons connecting polysynaptically to WAT was activated. Our data suggested that the PVN–sympathetic nerve–adipose circuit is important for the regulation of adipokine expression and subsequent insulin resistance and depressive‐like behaviours induced by chronic restraint stress. Furthermore, we explored the molecular mechanism by which β‐adrenergic receptors translate sympathetic tone into the adipose response under chronic restraint stress.
Results
Chronic restraint stress induces depressive‐like behaviours and insulin resistance
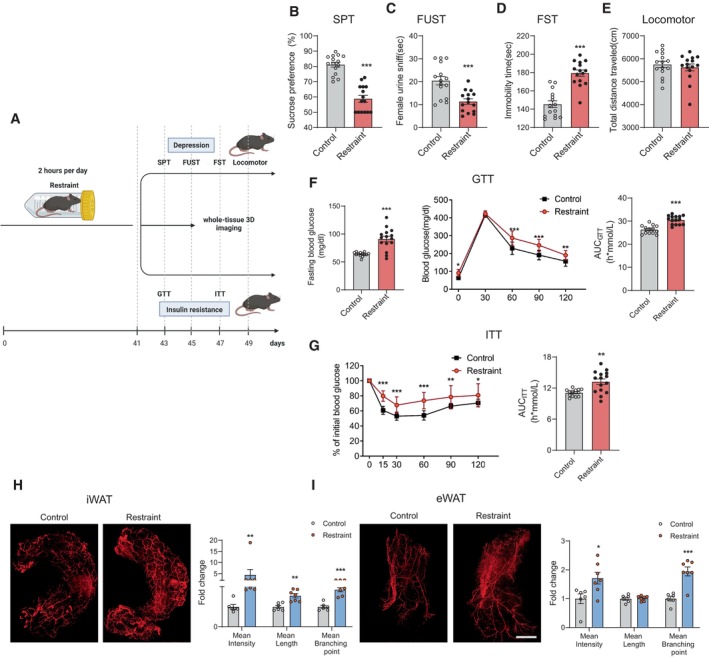
To confirm the relationship between chronic stress and depression and insulin resistance in our experimental system, the mice were subjected to 2 h of restraint stress per day for 42 consecutive days. Then, we conducted the sucrose preference test (SPT), female urine sniff test (FUST), forced swim test (FST), glucose tolerance test (GTT) and insulin tolerance test (ITT), to evaluate depression and insulin resistance, respectively (Fig 1A). In our study, chronic restraint stress induced depressive‐like behaviours, as evaluated by the SPT (Fig 1B), FUST (Fig 1C) and FST (Fig 1D), while locomotor activity was not affected (Fig 1E). The restraint group mice also displayed impaired responses in the GTT and ITT (Fig 1F and G), which were applied to determine the insulin resistance. These results suggest that chronic restraint stress can induce both depressive‐like behaviours and insulin resistance.
Figure 1. Chronic restraint stress induces depressive‐like behaviours and insulin resistance and increases sympathetic innervation of WAT.
-
AThe experimental timeline.
-
B–EChronic restraint stress induced depressive‐like behaviours, as evaluated by sucrose preference test (SPT) (B, Mann–Whitney U‐test, P < 0.0001), female urine sniffing test (FUST) (C, two‐tailed unpaired t‐test, t (28) = 4.118, P = 0.0003) and forced swim test (FST) (D, two‐tailed unpaired t‐test, t (28) = 6.710, P < 0.0001), but did not influence the locomotor activity (E, Mann–Whitney U‐test, P = 0.8381).
-
F, GInsulin resistance was evaluated by glucose tolerance test (GTT) (F, left, fasting blood glucose level, two‐tailed unpaired t‐test with Welch's correction, t (15.29) = 5.277, P < 0.0001; middle, glucose tolerance test, subgroups, F (1, 26) = 38.06, P < 0.0001; time, F (4, 104) = 782.3, P < 0.0001; subgroups × treatment, F (4, 104) = 5.171, P = 0.0008; right, the area under the curve of GTT, two‐tailed unpaired t‐test, t (26) = 5.977, P < 0.0001) and insulin tolerance test (ITT) (G, left, insulin tolerance test, subgroups, F (1, 26) = 22.59, P < 0.0001; time, F (5, 130) = 155.6, P < 0.0001; subgroups × treatment, F (5, 130) = 10.19, P < 0.0001; right, the area under the curve of ITT, two‐tailed unpaired t‐test with Welch's correction, t (17.46) = 3.707, P = 0.0017).
-
HLeft, representative images of immunohistochemical staining of TH in iWAT; right, statistical analysis of the histological data, mean nerve fibre density (Mann–Whitney U‐test, P = 0.0012), mean nerve fibre length (two‐tailed unpaired t‐test, t (11) = 4.081, P = 0.0018) and mean branching points (two‐tailed unpaired t‐test, t (11) = 6.637, P < 0.0001).
-
ILeft, representative images of immunohistochemical staining of TH in eWAT; right, statistical analysis of the histological data, mean nerve fibre density (Mann–Whitney U‐test, P = 0.0221), mean nerve fibre length (two‐tailed unpaired t‐test, t (11) = 0.2241, P = 0.8268) and mean branching points (two‐tailed unpaired t‐test, t (11) = 5.155, P = 0.0003).
Data information: Control group n = 15, restraint group n = 15 in (B–E); control group n = 13, restraint group n = 15 in (F) and (G); control group n = 6, restraint group n = 7 in (H) and (I). Shapiro–Wilk test and F‐test were used to test the normality and equal variance assumptions, respectively. Two‐tailed t‐tests were performed to assess differences between two experimental groups with normally distributed data and equal variance. Two‐tailed t‐tests with Welch's correction were used when a two‐sample comparison of means with unequal variances. For non‐normally distributed data, Mann–Whitney U‐tests were performed to compare two groups. For multiple groups, two‐way ANOVAs followed by Sidak multiple comparisons test were used. P < 0.05 was considered statistically significant. *P < 0.05, **P < 0.01, ***P < 0.001. Data are presented as means ± SEM. Scale bar: H and I, 2000 μm.
Source data are available online for this figure.
Chronic restraint stress increases sympathetic innervation of WAT
Since various stimuli alter sympathetic innervation of adipose tissue and subsequently induce physiological changes, such as thermogenesis in BAT and lipolysis in WAT under cold or fasting conditions (Wang et al, 2020), we next evaluated sympathetic innervation in subcutaneous inguinal WAT (iWAT) and visceral epididymal WAT (eWAT) after chronic stress examined by immunolabelling for tyrosine hydroxylase (TH)‐positive nerves. Compared with those from the control group, iWAT and eWAT from the chronic restraint group, as evaluated by whole‐tissue 3D imaging (Fig 1H and I, left panel), displayed significantly more sympathetic innervation. Quantitation of whole‐tissue 3D imaging data revealed that chronic stress significantly increased the mean nerve fibre density (by 344.51% in iWAT and by 71.22% in eWAT), mean nerve fibre length (by 55.21% in iWAT and no significant change in eWAT) and mean nerve branching points (by 85.54% in iWAT and by 94.57% in eWAT; Fig 1H and I, right panel). These data show that chronic restraint stress induced alterations in sympathetic structure, which may cause physiological changes in WAT and account for subsequent mental and metabolic disorders.
PVN is involved in the regulation of sympathetic innervation in WAT under chronic restraint stress
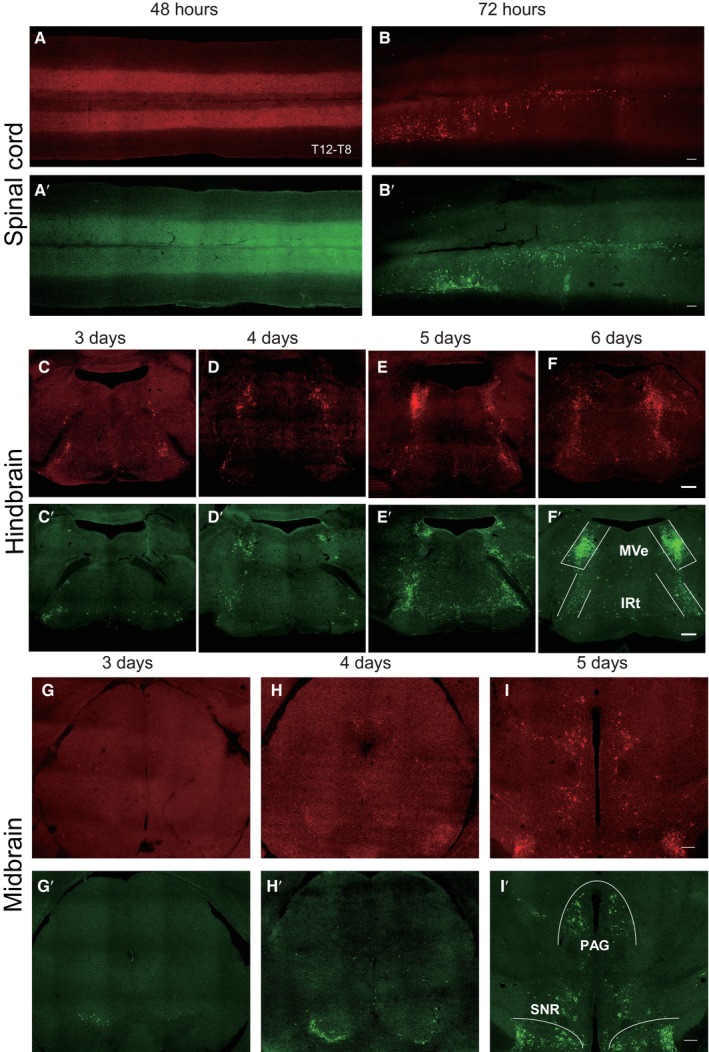
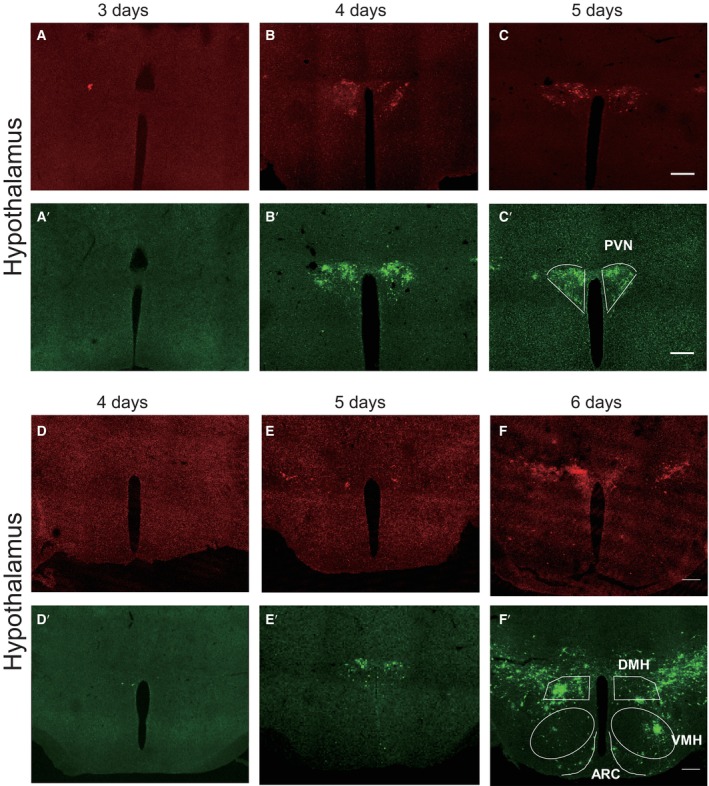
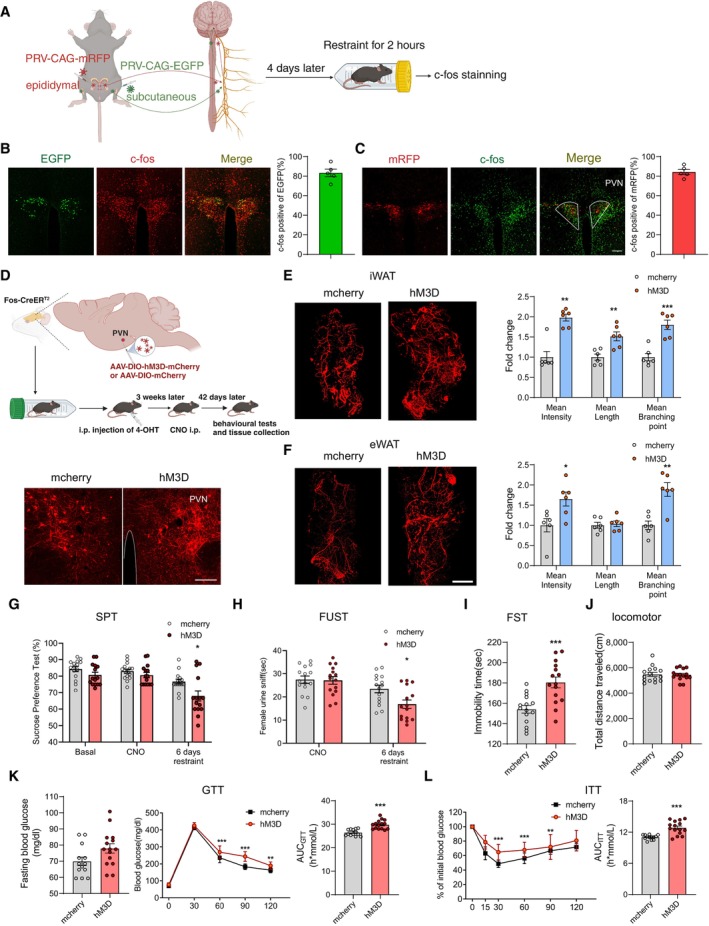
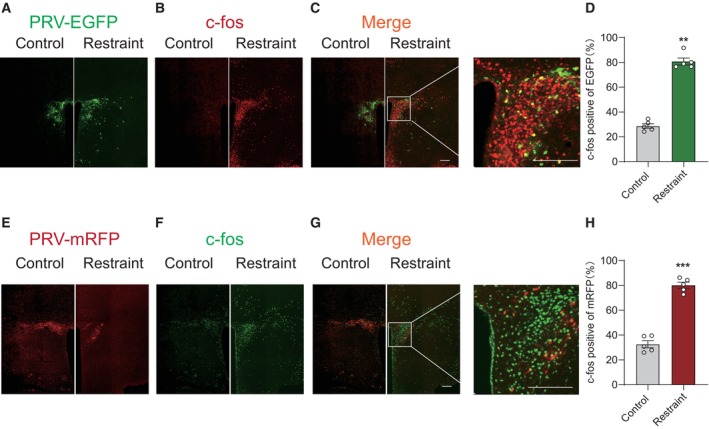
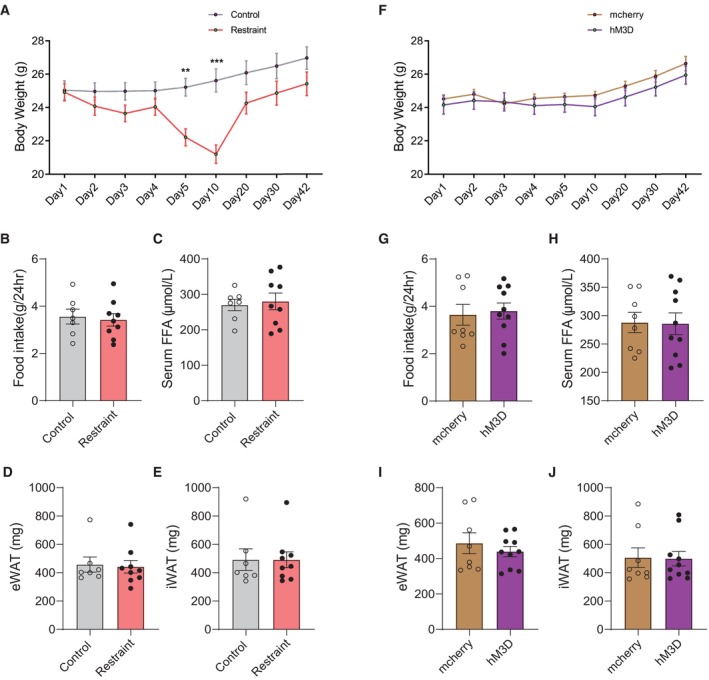
To determine which brain regions might be involved in the regulation of stress‐evoked increases in sympathetic innervation in WAT, we injected PRV‐CAG‐EGFP or PRV‐CAG‐mRFP into iWAT or eWAT, respectively, for retrograde tracing. 72 h after injection, both PRV‐CAG‐EGFP and PRV‐CAG‐mRFP were found in the thoracic vertebra (T8 to T12; Fig 2A, B and A′, B′). Our data showed that the spread of infection in the brain increased with the length of the postinjection interval. Three days after injection, PRV‐labelled cells were found in the hindbrain and midbrain, including medial vestibular nucleus (MVe), intermediate reticular nucleus (IRt; Fig 2C–F and C′–F′) and substantia nigra (SNR; Fig 2G–I and G′–I'). At the 4th day after injection, PRV‐labelled cells were found in the PVN (Fig 3A–C and A′–C′). The other two hypothalamus regions which are involved in mediating the SNS, DMH and VMH, were labelled at the 5th and 6th day, respectively (Fig 3D–F and D′–F′). Four days after the surgery, we subjected these mice to 2 h of restraint stress and performed c‐Fos staining (Fig 4A). The PVN was labelled with PRV‐CAG‐EGFP from iWAT (Fig 4B, left) or PRV‐CAG‐mRFP from eWAT (Fig 4C, left), and most labelled neurons were positive for c‐Fos, a marker of cell activation (83.26 ± 3.832% for iWAT and 84.28 ± 2.575% for eWAT, Fig 4B and C, right). Without restraint stress, the percentage of c‐Fos positive of PRV‐labelled cells decreased significantly (Fig EV1). This anatomic evidence indicated that PVN may regulate sympathetic innervation in WAT under restraint stress. To test this hypothesis, we injected AAV‐DIO‐hM3D‐mcherry into the PVN of Fos‐CreERT2 mice. After exposure to 2 h of restraint stress, Fos‐CreERT2 mice were intraperitoneally injected with 4‐hydroxytamoxifen (4‐OHT, 50 mg/kg) to induce the expression of hM3D‐mcherry in order to label PVN‐activated neurons during that restraint stress. Three weeks later, we intraperitoneally injected clozapine‐N‐oxide (CNO, 0.3 mg/kg, every 2 days for 42 days) to activate previous hM3D‐mcherry‐labelled PVN neurons (Fig 4D). TH staining showed that chronically activating PVN neurons responding to restraint stress increased sympathetic innervation in iWAT and eWAT (Fig 4E and F). Previous studies showed that acute activation of the sympathetic outputs in WAT induced lipolysis under cold exposure or fasting (Zeng et al, 2015; Wang et al, 2020). Our data showed that there was no significant difference in the serum free fatty acids (FFA), the mass of WAT, food intake and body weight after chronic restraint (Fig EV2A–E) or chronic activation of PVN paradigm (Fig EV2F–J).
Figure 2. Time course of infection of spinal cord and brain by pseudorabies virus.
-
A–IThe time course of infection of spinal cord and brain after PRV‐mRFP injected into eWAT; A′–I′, the time course of infection of spinal cord and brain after PRV‐EGFP injected into iWAT. (A and B) Photomicrograph illustrating the PRV‐mRFP labelling in the spinal cord (thoracic vertebra T12‐T8) 48 and 72 h after PRV‐mRFP injected into eWAT. (A′ and B′) Photomicrograph illustrating the PRV‐EGFP labelling in the spinal cord (thoracic vertebra T12‐T8) 48 and 72 h after PRV‐EGFP injected into iWAT.
-
C–FPhotomicrograph illustrating the PRV‐mRFP labelling in the hindbrain 3–6 days after PRV‐mRFP injected into eWAT. (C′–F′) Photomicrograph illustrating the PRV‐EGFP labelling in the hindbrain 3–6 days after PRV‐EGFP injected into iWAT, MVe: medial vestibular nucleus, IRt: intermediate reticular nucleus.
-
G–IPhotomicrograph illustrating the PRV‐mRFP labelling in the midbrain 3–5 days after PRV‐mRFP injected into eWAT. (G′–I′) Photomicrograph illustrating the PRV‐EGFP labelling in the midbrain 3–5 days after PRV‐EGFP injected into iWAT, PAG: periaqueductal grey, SNR: substantia nigra, reticular part.
Source data are available online for this figure.
Figure 3. Time course of infection of hypothalamus by pseudorabies virus.
-
A–CPhotomicrograph illustrating the PRV‐mRFP labelling in the hypothalamus 3–5 days after PRV‐mRFP injected into eWAT. (A′–C′) Photomicrograph illustrating the PRV‐EGFP labelling in the hypothalamus 3–5 days after PRV‐EGFP injected into iWAT, PVN: paraventricular nucleus of hypothalamus.
-
D–FPhotomicrograph illustrating the PRV‐mRFP labelling in the hypothalamus 4–6 days after PRV‐mRFP injected into eWAT. (D′–F′) Photomicrograph illustrating the PRV‐EGFP labelling in the hypothalamus 4–6 days after PRV‐EGFP injected into iWAT, DMH: dorsomedial hypothalamus, VMH: ventromedial hypothalamus, ARC: arcuate nucleus. Scale bar: 200 μm.
Source data are available online for this figure.
Figure 4. Subset of neurons in PVN are activated by restraint stress and chronic activation induces depressive‐like behaviours and insulin resistance.
-
ADiagram illustrating retrograde tracing virus injection and subsequent experiments.
-
B, CBoth PRV‐EGFP tracing from iWAT (B, left) and PRV‐mRFP tracing from eWAT (C, left) colocalized with c‐Fos in PVN neurons. The percentage of colocalization (B and C, right).
-
DUpper, diagram illustrating virus injection in PVN and subsequent experiments; lower, mcherry and hM3D‐mcherry expression in PVN.
-
E, FImmunohistochemical staining of TH in iWAT and eWAT (E and F, left). Statistical analysis of the histological data of iWAT and eWAT (E and F, right).
-
G–JChronically reactivating hm3D‐labelled PVN neurons increased susceptibility to stress‐induced depressive‐like behaviours, as evaluated by SPT (G, subgroups, F (1, 28) = 11.22, P = 0.0023; treatment, F (2, 56) = 17.57, P < 0.001; subgroups × treatment, F (2, 56) = 1.583, P = 0.2144), FUST (H, subgroups, F (1, 28) = 3.800, P = 0.0613; treatment, F (1, 28) = 21.54, P < 0.001; subgroups × treatment, F (1, 28) = 4.162, P = 0.0509) and FST (I, two‐tailed unpaired t‐test, t (28) = 4.075, P = 0.0003), but did not influence the locomotor activity (J, two‐tailed unpaired t‐test, t (28) = 0.1614, P = 0.8729).
-
K, LChronically reactivating hM3D‐labelled PVN neurons also induced insulin resistance evaluated by GTT (K, left, fasting blood glucose level, two‐tailed unpaired t‐test, t (26) = 2.021, P = 0.0537; middle, glucose tolerance test, subgroups, F (1, 26) = 28.77, P < 0.0001; time, F (4, 104) = 1,195, P < 0.0001; subgroups × treatment, F (4, 104) = 8.362, P < 0.0001; right, the area under the curve of GTT, two‐tailed unpaired t‐test, t (26) = 5.274, P < 0.0001) and ITT (L, left, subgroups, F (1, 26) = 16.60, P = 0.0004; time, F (5, 130) = 103.0, P < 0.0001; subgroups × treatment, F (5, 130) = 4.292, P = 0.0012; right, the area under the curve of ITT, two‐tailed unpaired t‐test with Welch's correction, t (17.85) = 5.124, P < 0.0001).
Data information: N = 5 in (B) and (C); mcherry group n = 6, hM3D group n = 6 in (E) and (F); mcherry group n ≥ 13, hM3D group n = 15 in (G–L). Shapiro–Wilk test and F‐test were used to test the normality and equal variance assumptions, respectively. Two‐tailed t‐tests were performed to assess differences between two experimental groups with normally distributed data and equal variance. Two‐tailed t‐tests with Welch's correction were used when a two‐sample comparison of means with unequal variances. For non‐normally distributed data, Mann–Whitney U‐tests were performed to compare two groups. For multiple groups, two‐way ANOVAs followed by Sidak multiple comparisons test were used. P < 0.05 was considered statistically significant. *P < 0.05, **P < 0.01, ***P < 0.001. Data are presented as means ± SEM. Scale bar: B–D, 100 μm; E and F, 2,000 μm.
Source data are available online for this figure.
Figure EV1. PVN neurons traced by pseudorabies virus are activated under restraint stress.
-
A–HRepresentative images showing PVN neurons traced by PRV‐EGFP from iWAT (A, C, C′, green) were activated by restraint stress (B, C, C′, red) on the 4th day after injection. (D) The percentage of colocalization of PRV‐EGFP and c‐Fos, Mann–Whitney U‐test, P = 0.0079. Representative images showing PVN neurons traced by PRV‐mRFP from eWAT (E, G, G′, red) were activated by restraint stress (F, G, G′, green). (H) The percentage of colocalization of PRV‐mRFP and c‐Fos, two‐tailed unpaired t‐test, t (8) = 12.61, P < 0.0001. Control group n = 5, restraint group n = 5 in (D) and (H). Shapiro–Wilk test and F‐test were used to test the normality and equal variance assumptions, respectively. Two‐tailed t‐tests were performed to assess differences between two experimental groups with normally distributed data and equal variance. Two‐tailed t‐tests with Welch's correction were used when a two‐sample comparison of means with unequal variances. For non‐normally distributed data, Mann–Whitney U‐tests were performed to compare two groups. P < 0.05 was considered statistically significant. **P < 0.01, ***P < 0.001. Data are presented as means ± SEM. Scale bar: A–C and E–G, 200 μm.
Source data are available online for this figure.
Figure EV2. Body weight, fat weight, food intake and serum FFA level under chronic restraint stress and PVN activation paradigms.
-
AThe body weight of mice during chronic restraint paradigms. subgroups, F (1, 14) = 4.414, P = 0.0542; time, F (8, 112) = 52.15, P < 0.0001; subgroups × time, F (8, 112) = 26.58, P < 0.0001.
-
BThe amount of accumulative of 24‐h food intake after chronic restraint treatment. two‐tailed unpaired t‐test, t (14) = 0.3420, P = 0.7374.
-
CThe serum FFA level after chronic restraint treatment. two‐tailed unpaired t‐test, t (14) = 0.3358, P = 0.7420.
-
D–FThe mass of eWAT (D, Mann–Whitney U‐test, P = 0.9182) and iWAT (E, Mann–Whitney U‐test, P > 0.9999) after chronic restraint treatment. F. the body weight of mice during chronic PVN activation. subgroups, F (1, 16) = 0.5661, P = 0.4627; time, F (8, 128) = 51.72, P < 0.0001; subgroups × time, F (8, 128) = 1.772, P = 0.0883.
-
GThe amount of accumulative of 24‐h food intake after chronically reactivating PVN neurons. Mann–Whitney U‐test, P = 0.7618.
-
HThe serum FFA level after chronically reactivating PVN neurons. two‐tailed unpaired t‐test, t (16) = 0.08091, P = 0.9365.
-
I, JThe mass of eWAT (I, two‐tailed unpaired t‐test, t (16) = 0.7674, P = 0.4540) and iWAT (J, Mann–Whitney U‐test, P = 0.8968) after chronic restraint treatment.
Data information: Control group n = 7, restraint group n = 9 in (A–E); mcherry group n = 8, hM3D group n = 10 in (F–J). Shapiro–Wilk test and F‐test were used to test the normality and equal variance assumptions, respectively. Two‐tailed t‐tests were performed to assess differences between two experimental groups with normally distributed data and equal variance. Two‐tailed t‐tests with Welch's correction were used when a two‐sample comparison of means with unequal variances. For non‐normally distributed data, Mann–Whitney U‐tests were performed to compare two groups. For multiple groups, two‐way ANOVAs followed by Sidak multiple comparisons test were used. P < 0.05 was considered statistically significant. **P < 0.01, ***P < 0.001. Data are presented as means ± SEM.
Source data are available online for this figure.
PVN neurons responding to restraint stress increase susceptibility to depressive‐like behaviours and insulin resistance under chronic restraint stress
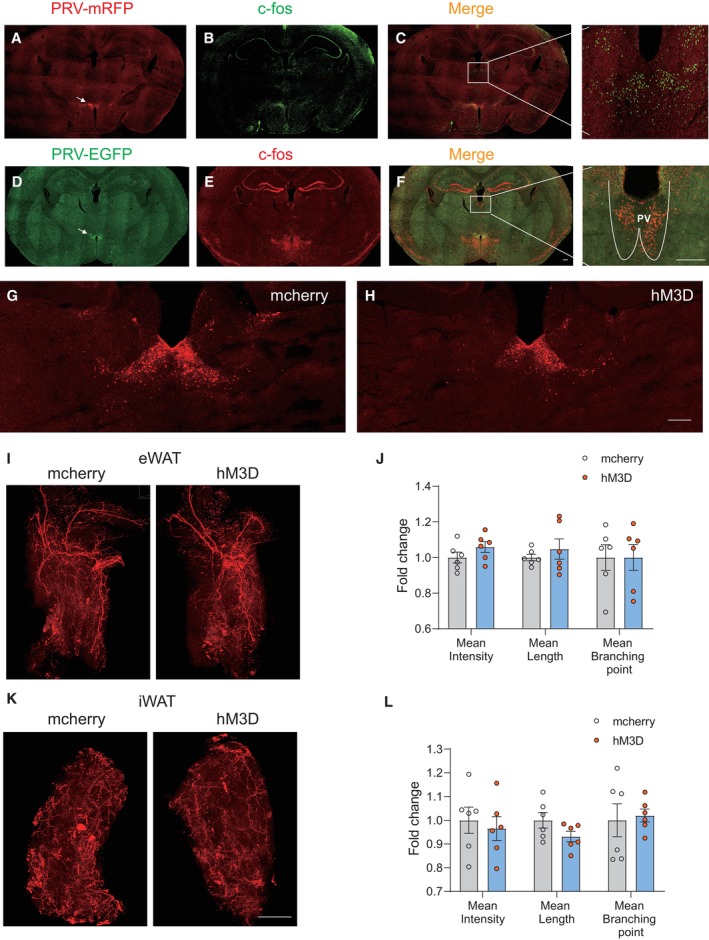
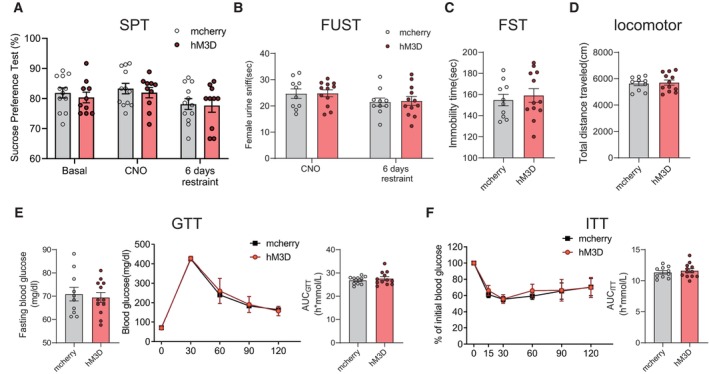
We next explored whether repeatedly activating PVN neurons responding to restraint stress also led to depression and insulin resistance. Our results showed that only chronically activating PVN neurons did not induce depressive‐like behaviours evaluated by SPT (Fig 4G) and FUST (Fig 4H), while additional 6 days of restraint stress treatment following chronic PVN activation paradigm induced depressive‐like behaviours in hM3D group mice but not in mcherry controls (Fig 4G–J). And our data suggested that chronically activating PVN neurons impaired glucose tolerance and insulin sensitivity of hM3D group mice (Fig 4K and L). Collectively, these experiments showed that chronically activating PVN neurons responding to restraint achieved effects similar to those of chronic restraint stress, enhancing sympathetic innervation in WAT, insulin resistance and susceptibility to stress‐induced depressive‐like behaviours. We next explored whether chronically activating the other brain areas that were activated by restraint stress could achieve same effects as PVN. Six days after PRV injection, the paraventricular thalamic nucleus (PV) was not labelled by PRV‐CAG‐mRFP from eWAT (Fig EV3A and C) or PRV‐CAG‐EGFP from iWAT (Fig EV3D and F), which was activated by restraint stress (Fig EV3A, B, E and F). Chronically activating PV with the same viral approach than the PVN (Fig EV3G and H) did not affect sympathetic innervation in WAT (Fig EV3I–L), depressive‐like behaviours (Fig EV4A–D) or insulin resistance (Fig EV4E and F). These results highlighted the importance of PVN in the increased sympathetic innervation, depressive‐like behaviours and insulin resistance induced by chronic restraint stress.
Figure EV3. Chronic activation of the PV neurons responding to restraint stress did not affect sympathetic innervation in WAT.
-
APhotomicrograph illustrating the PRV‐mRFP labelling in the hypothalamus 6 days after PRV‐mRFP injected into eWAT; arrow pointed to the DMH traced by PRV‐mRFP.
-
Bc‐Fos staining after 2 h restraint in the same brain slice.
-
C, C′Low and high magnification of the photomicrograph illustrating single c‐Fos immunolabelling (green) without PRV‐mRFP labelling (red) in the paraventricular thalamic nucleus (PV).
-
DPhotomicrograph illustrating the PRV‐EGFP labelling in the hypothalamus 6 days after PRV‐EGFP injected into iWAT; arrow pointed to the DMH traced by PRV‐EGFP.
-
Ec‐Fos staining after 2 h restraint in the same brain slice.
-
F, F′Low and high magnification of the photomicrograph illustrating single c‐Fos immunolabelling (red) without PRV‐EGFP labelling (green) in the PV.
-
G, HMcherry and hM3D‐mcherry expression in PV.
-
I–LImmunohistochemical staining of TH in iWAT and eWAT (I and K). Statistical analysis of the histological data of iWAT and eWAT (J and L).
Data information: mcherry group n = 6, hM3D group n = 6 in (I–L). Shapiro–Wilk test and F‐test were used to test the normality and equal variance assumptions, respectively. Two‐tailed t‐tests were performed to assess differences between two experimental groups with normally distributed data and equal variance. Two‐tailed t‐tests with Welch's correction were used when a two‐sample comparison of means with unequal variances. For non‐normally distributed data, Mann–Whitney U‐tests were performed to compare two groups. P < 0.05 was considered statistically significant. Data are presented as means ± SEM. Scale bar: A–H, 200 μm; I and K, 2,000 μm.
Source data are available online for this figure.
Figure EV4. Chronic activation of the PV neurons responding to restraint stress did not affect depressive‐like behaviours or insulin resistance.
-
A–DChronically reactivating hM3D‐labelled PV neurons did not affect the depressive‐like behaviours, as evaluated by SPT (A, subgroups, F (1, 20) = 0.8020, P = 0.3812; treatment, F (2, 40) = 2.940, P = 0.0644; subgroups × treatment, F (2, 40) = 0.03915, P = 0.9616), FUST (B, subgroups, F (1, 20) = 0.04271, P = 0.8384; treatment, F (1, 20) = 2.907, P = 0.1037; subgroups × treatment, F (1, 20) = 0.007554, P = 0.9316) and FST (C, two‐tailed unpaired t‐test, t (20) = 0.4940, P = 0.6267) and the locomotor activity (D, two‐tailed unpaired t‐test, t (20) = 0.2734, P = 0.7874).
-
E, FChronically reactivating hM3D‐labelled PV neurons did not induce insulin resistance evaluated by GTT (E, left, fasting blood glucose level, two‐tailed unpaired t‐test, t (20) = 0.4146, P = 0.6829; middle, glucose tolerance test, subgroups, F (1, 20) = 0.2836, P = 0.6002; time, F (4, 80) = 497.7, P < 0.0001; subgroups × treatment, F (4, 80) = 0.7470, P = 0.5629; right, the area under the curve of GTT, two‐tailed unpaired t‐test, t (20) = 0.7050, P = 0.4889) and ITT (F, left, subgroups, F (1, 20) = 0.8558, P = 0.3659; time, F (5, 100) = 131.8, P < 0.0001; subgroups × treatment, F (5, 100) = 1.249, P = 0.2923; right, the area under the curve of ITT, two‐tailed unpaired t‐test with Welch's correction, t (20) = 0.5915, P = 0.5608).
Data information: mcherry group n = 10, hM3D group n = 12 in (A–F). Shapiro–Wilk test and F‐test were used to test the normality and equal variance assumptions, respectively. Two‐tailed t‐tests were performed to assess differences between two experimental groups with normally distributed data and equal variance. Two‐tailed t‐tests with Welch's correction were used when a two‐sample comparison of means with unequal variances. For non‐normally distributed data, Mann–Whitney U‐tests were performed to compare two groups. For multiple groups, two‐way ANOVAs followed by Sidak multiple comparisons test were used. P < 0.05 was considered statistically significant. Data are presented as means ± SEM.
Source data are available online for this figure.
The PVN–sympathetic nerve–β‐adrenergic receptor pathway is involved in depression and insulin resistance induced by chronic restraint stress
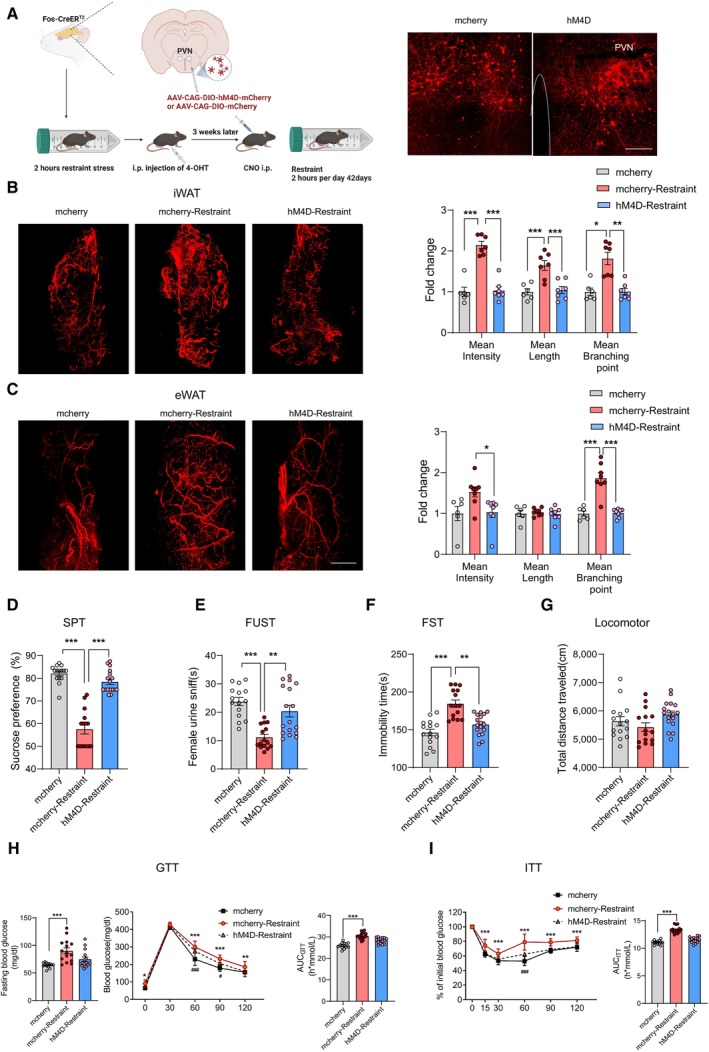
To further verify the role of PVN neurons responding to restraint stress in depressive‐like behaviours and insulin resistance induced by chronic restraint stress, we specifically expressed hM4D in PVN neurons activated under restraint stress (Fig 5A). Inhibition of those labelled PVN neurons diminished the increased sympathetic innervation in WAT induced by chronic stress (Fig 5B and C). With the sympathetic innervation of WAT restored to the control level, both the depression level (Fig 5D–G) and insulin sensitivity (Fig 5H and I) were ameliorated in the hM4D group of mice. These data suggested that PVN neurons activated by restraint were required for the chronic stress‐induced sympathetic innervation in WAT, depressive‐like behaviours and insulin resistance.
Figure 5. PVN neurons responding to restraint stress mediate sympathetic innervation in WAT, depressive‐like behaviours and insulin resistance under chronic restraint stress.
-
ALeft, Diagram illustrating virus injection in PVN and subsequent experiments; right, representative images of mcherry and hM4D‐mcherry expression in PVN.
-
B, CRepresentative images of immunohistochemical staining of TH in iWAT (B, left) and eWAT (C, left). Statistical analysis of the histological data of iWAT (mean nerve fibre density (F (2, 17) = 46.51, P < 0.001), mean nerve fibre length (F (2, 17) = 13.75, P = 0.0003) and mean branching points (Kruskal–Wallis test, P = 0. 0009) (B, right) and eWAT (mean nerve fibre density (Kruskal–Wallis test, P = 0. 0084), mean nerve fibre length (F (2, 19) = 0.1589, P = 0.8542) and mean branching points (F (2, 19) = 27.78, P < 0.0001) (C, right).
-
D–IDepression was evaluated by SPT (D, Kruskal–Wallis test, P < 0.0001), FUST (E, Kruskal–Wallis test, P < 0.0001), FST (F, Kruskal–Wallis test, P < 0.0001) and locomotor activity (G, F (2, 44) = 2.511, P = 0.0928). Insulin resistance was evaluated by GTT (H, left, fasting blood glucose level, Kruskal–Wallis test, P = 0.0002; middle, glucose tolerance test, subgroups, F (2, 40) = 36.63, P < 0.0001; time, F (4, 160) = 1,209, P < 0.0001; subgroups × treatment, F (8, 160) = 3.636, P = 0.0006; right, the area under the curve of GTT, F (2, 40) = 36.60, P < 0.0001) and ITT (left, I, subgroups, F (2, 40) = 50.42, P < 0.0001; time, F (5, 200) = 276.8, P < 0.0001; subgroups × treatment, F (10, 200) = 7.833, P < 0.0001; right, the area under the curve of ITT, F (2, 40) = 73.45, P < 0.0001). * for mcherry‐restraint vs. mcherry, # for hM4D‐restraint vs. mcherry in (H) and (I).
Data information: mcherry group n = 6, mcherry‐restraint group n ≥ 7, hM4D‐restraint group n ≥ 7 in (B) and (C); mcherry group n ≥ 13, mcherry‐restraint group n ≥ 15, hM4D‐restraint group n ≥ 15 in (D–I). Shapiro–Wilk test was used to test the normality. For three groups with normally distributed data, one‐way analyses of variance (ANOVAs) followed by Tukey's multiple comparisons test were used. For non‐normally distributed data, the Kruskal–Wallis test followed by Dunn's multiple comparisons test was used. For multiple groups, two‐way ANOVAs followed by Sidak multiple comparisons test were used. P < 0.05 was considered statistically significant. *P < 0.05, **P < 0.01, ***P < 0.001; # P < 0.05, ### P < 0.001. Data are presented as means ± SEM. Scale bar: A 100 μm; B and C, 2000 μm.
Source data are available online for this figure.
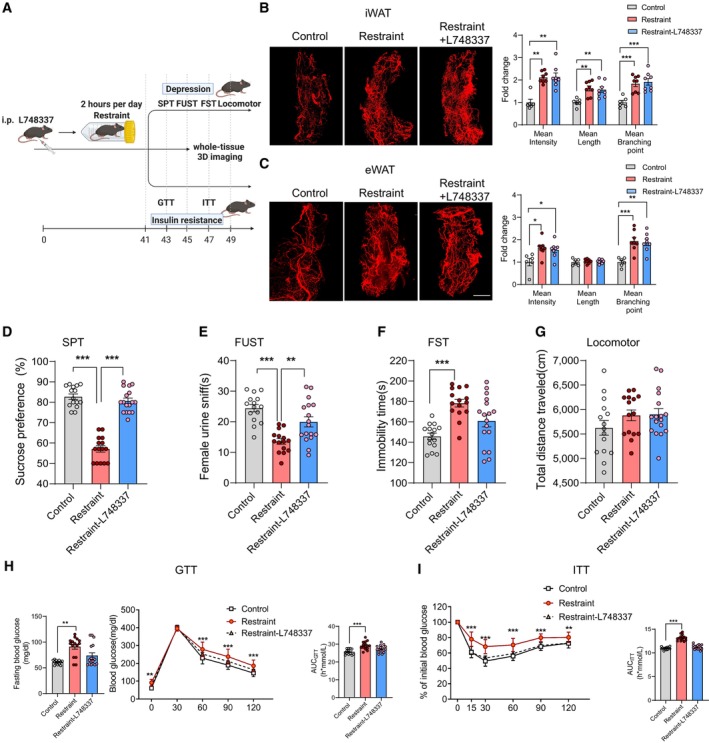
Our results revealed a correlation between increased sympathetic innervation in WAT and depression and insulin resistance. In addition, previous studies have shown that the β‐adrenergic receptors located in the membranes of adipocytes mediate the regulation of adipose tissue metabolic and endocrine functions by the SNS, including lipolysis, thermogenesis and adipokine secretion (Zeng et al, 2015; Schweizer et al, 2019; Wang et al, 2020). Together, these findings raised the question of whether β‐adrenergic signalling in adipose tissue was required for chronic restraint stress‐induced depression and insulin insensitivity. To answer this question, we used L748337 (5 μM, 10 ml/kg, intraperitoneal injection, once every day), a β‐adrenergic receptor antagonist, to block β‐adrenergic signalling in adipose tissue during chronic restraint stress (Fig 6A). L748337 did not influence the increased sympathetic innervation induced by chronic restraint stress (Fig 6B and C), but ameliorated the depressive‐like behaviours (Fig 6D–G) and impaired insulin sensitivity (Fig 6H and I). Taken together, these results suggest that the brain–adipose circuit, PVN–sympathetic nerve–β‐adrenergic receptor pathway, serves an important role in depression and insulin resistance induced by chronic restraint stress.
Figure 6. β‐adrenergic receptors are required for the induction of depressive‐like behaviours and insulin resistance by chronic restraint stress.
-
AThe experimental timeline.
-
BLeft, representative images of immunohistochemical staining of TH in iWAT; right, statistical analysis of the histological data, mean nerve fibre density (Kruskal–Wallis test, P = 0.0006), mean nerve fibre length (F (2, 19) = 8.808, P = 0.0020) and mean branching points (F (2, 19) = 12.39, P = 0.0002).
-
CLeft, representative images of immunohistochemical staining of TH in eWAT; right, statistical analysis of the histological data, mean nerve fibre density (F (2, 19) = 5.631, P = 0.0120), mean nerve fibre length (F (2, 19) = 0.1791, P = 0.8374) and mean branching points (F (2, 19) = 11.98, P = 0.0004).
-
D–IDepression was evaluated by SPT (D, Kruskal–Wallis test, P < 0.0001), FUST (E, F (2, 44) = 16.24, P < 0.0001), FST (F, F (2, 44) = 12.18, P < 0.0001) and locomotor activity (G, F (2, 44) = 1.482, P = 0.2383). Insulin resistance was evaluated by GTT (H, left, fasting blood glucose level, Kruskal–Wallis test, P = 0.0016; middle, glucose tolerance test, subgroups, F (2, 42) = 13.61, P < 0.0001; time, F (4, 168) = 1,158, P < 0.0001; subgroups × treatment, F (8, 168) = 3.177, P = 0.0022; right, the area under the curve of GTT, F (2, 42) = 11.49, P = 0.0001) and ITT (I, left, subgroups, F (2, 42) = 34.29, P < 0.0001; time, F (5, 210) = 442.7, P < 0.0001; subgroups × treatment, F (10, 210) = 9.277, P < 0.0001; right, the area under the curve of ITT, F (2, 42) = 93.23, P < 0.0001).
Data information: Control group n = 6, restraint group n = 8, restraint‐L748337 group n = 8 in (B) and (C); control group n = 15, restraint group n = 15, restraint‐L748337 group n = 17 in (D–G); control group n = 13, restraint group n = 15, restraint‐L748337 group n = 17 in (H) and (I). Shapiro–Wilk test was used to test the normality. For three groups with normally distributed data, one‐way analyses of variance (ANOVAs) followed by Tukey's multiple comparisons test were used. For non‐normally distributed data, the Kruskal–Wallis test followed by Dunn's multiple comparisons test was used. For multiple groups, two‐way ANOVAs followed by Sidak multiple comparisons test were used. P < 0.05 was considered statistically significant. *P < 0.05, **P < 0.01, ***P < 0.001. Data are presented as means ± SEM. Scale bar: B and C, 2,000 μm.
Source data are available online for this figure.
Regulation of adipokines related to depression and insulin resistance under chronic restraint stress
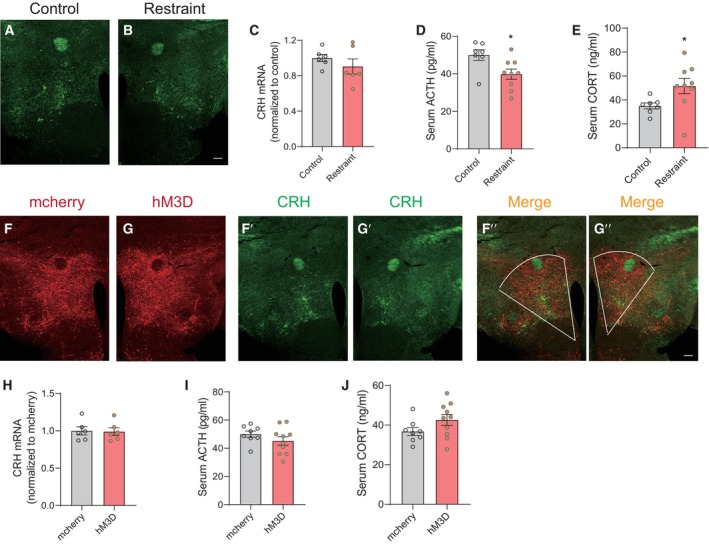
Our results showed that chronic restraint stress increased sympathetic innervation in WAT which raised the question of what physiological changes in WAT occurred and which candidates contributed to the development of depression and insulin resistance under chronic restraint stress. In addition to playing a pivotal role in glucose and lipid metabolism, adipose tissue is a highly active endocrine organ that secretes a large number of adipokines. These adipokines are involved in diverse processes, including appetite control, inflammation, insulin sensitivity and mood disorders (Fasshauer & Blüher, 2015; Petersen & Shulman, 2018; Lee et al, 2019). RNA sequencing results showed that some adipokines exerting beneficial effects on insulin sensitivity decreased under chronic restraint stress, including leptin, adiponectin, Angptl4 and Sfrp5 (Fig 7A, left iWAT, right eWAT). The mRNA level of Fbn1 gene also decreased (Fig 7A), encoding a proprotein which undergoes post‐translational proteolytic processing and generates two proteins, a mature fibrillin‐1 and C terminus asprosin. Romere et al (2016) have reported that asprosin levels increase in insulin‐resistant humans and mice, and immunologic sequestration of asprosin could ameliorate insulin resistance. ELISA (Fig 7B), Real‐time PCR analysis (Fig 7C, upper iWAT, lower eWAT) and western blotting (Fig 7D, upper iWAT, lower eWAT) confirmed the RNA‐seq results. Chronic activation of PVN neurons responding to restraint stress achieved effects similar to those of chronic restraint stress, while the expression of adiponectin was unchanged in eWAT, even increased in iWAT (Fig 8A–D). As the HPA axis is a major neuroendocrine system associated with the stress response and links to the function of WAT in physiologic and in pathologic conditions, we assayed the expression of corticotropin‐releasing hormone (CRH) in the PVN, the serum adrenocorticotropin (ACTH) and corticosterone (CORT) levels, under chronic restraint stress or PVN activation paradigms (Fig EV5). Our results showed that chronic restraint treatment increased the serum CORT level (Fig EV5E), while chronic activation of PVN did not affect the serum CORT level (Fig EV5J). It is shown that CORT inhibited the expression of adiponectin (Dang et al, 2017; Kaikaew et al, 2019). These data indicated that increased CORT level may account for the downregulation of adiponectin under chronic restraint stress. Both leptin and adiponectin have been extensively investigated, showing insulin sensitivity and antidepressant effects. The serum levels of Angptl4 and Sfrp5 are negatively correlated with insulin resistance, while asprosin is positively correlated with insulin resistance. There is no research about the effect of Angptl4, Sfrp5 and asprosin on mood disorders. Taken together, the findings suggested that decreased levels of adipokines, including leptin, adiponectin, Angptl4 and Sfrp5, may account for the depressive‐like behaviours and insulin resistance induced by chronic restraint stress.
Figure 7. Regulation of adipokines associated with depression and insulin resistance under chronic restraint stress.
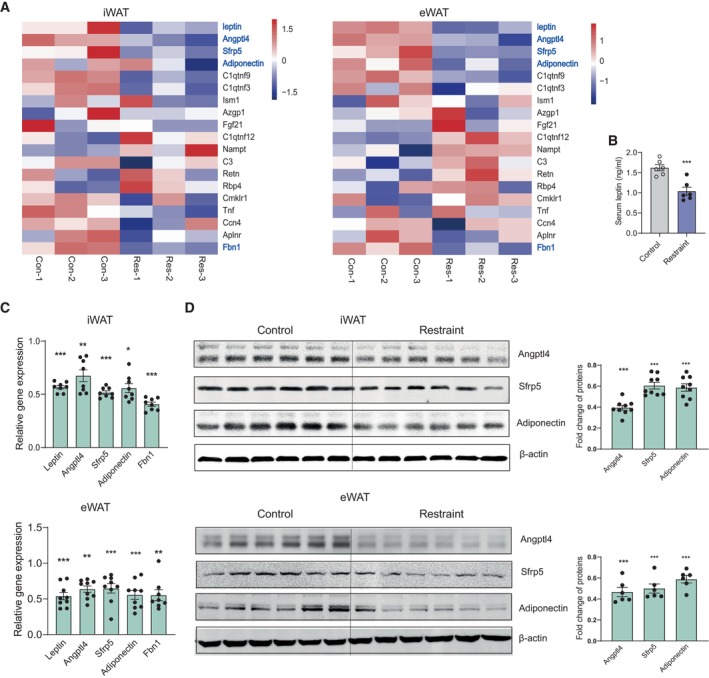
- Heat map showing relative expression levels for the adipokines involved with insulin resistance under chronic restraint stress (left iWAT, right eWAT). Control group (Con‐1,2,3) n = 3, Restraint group (Res‐1,2,3) n = 3.
- ELISA result showing decreased serum leptin level under chronic restraint stress. Control group n = 6, Restraint group n = 6.
- Real‐time PCR analysis of leptin, Angptl4, Sfrp5, adiponectin and Fbn1 under chronic restraint stress (upper iWAT, lower eWAT).
- Representative immunoblots and quantification of Angptl4, Sfrp5 and adiponectin proteins (upper iWAT, lower eWAT).
Data information: control group n = 6, restraint group n = 6 in (B); control group n ≥ 6, restraint group n ≥ 6 in (C) and (D). Shapiro–Wilk test and F‐test were used to test the normality and equal variance assumptions, respectively. Two‐tailed t‐tests were performed to assess differences between two experimental groups with normally distributed data and equal variance. Two‐tailed t‐tests with Welch's correction were used when a two‐sample comparison of means with unequal variances. For non‐normally distributed data, Mann–Whitney U‐tests were performed to compare two groups. P < 0.05 was considered statistically significant. *P < 0.05, **P < 0.01, ***P < 0.001. Data are presented as means ± SEM.
Source data are available online for this figure.
Figure 8. Regulation of adipokines associated with depression and insulin resistance under chronic activation of PVN neurons responding to restraint stress.
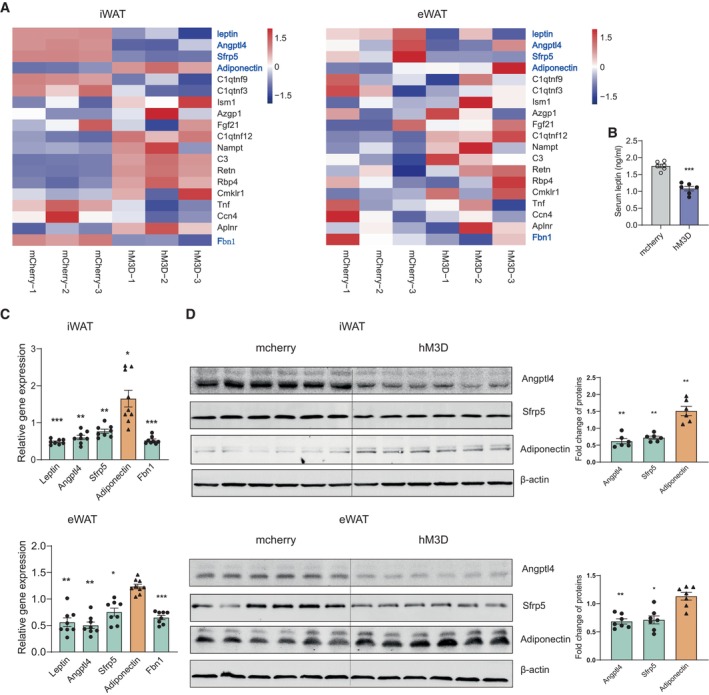
- Heat map showing relative expression levels for the adipokines involved with insulin resistance after chronically activating PVN neurons responding to restraint stress (left iWAT, right eWAT). Control group (mcherry‐1,2,3) n = 3, hM3D group (hM3D‐1,2,3) n = 3.
- ELISA result showing decreased serum leptin level.
- Real‐time PCR analysis of leptin, Angptl4, Sfrp5, adiponectin and Fbn1 (upper iWAT, lower eWAT).
- Representative immunoblots and quantification of Angptl4, Sfrp5 and adiponectin (upper iWAT, lower eWAT).
Data information: mcherry group n = 6, hM3D group n = 6 in (B); mcherry group n ≥ 7, hM3D group n ≥ 7 in (C) and (D). Shapiro–Wilk test and F‐test were used to test the normality and equal variance assumptions, respectively. Two‐tailed t‐tests were performed to assess differences between two experimental groups with normally distributed data and equal variance. Two‐tailed t‐tests with Welch's correction were used when a two‐sample comparison of means with unequal variances. For non‐normally distributed data, Mann–Whitney U‐tests were performed to compare two groups. P < 0.05 was considered statistically significant. *P < 0.05, **P < 0.01, ***P < 0.001. Data are presented as means ± SEM.
Source data are available online for this figure.
Figure EV5. HPA activity under chronic restraint stress and PVN activation paradigms.
-
A, BRepresentative images of immunohistochemical staining of CRH after chronic restraint stress treatment.
-
CReal‐time PCR analysis of CRH in hypothalamus under chronic restraint stress, two‐tailed unpaired t‐test, t (10) = 1.016, P = 0.3336, control group n = 6, restraint group n = 6.
-
D, EELISA results showing serum ACTH (D, Mann–Whitney U‐test, P = 0.0311) and CORT levels (E, two‐tailed unpaired t‐test, t (14) = 2.178, P = 0.0470) under chronic restraint stress, control group n = 7, restraint group n = 9.
-
F, GRepresentative images showing mcherry (F, F″) and hM3D‐mcherry (G, G") expression in PVN, immunohistochemical staining of CRH (F′ and G′).
-
HReal‐time PCR analysis of CRH in hypothalamus after chronically reactivating PVN neurons, two‐tailed unpaired t‐test, t (10) = 0.1353, P = 0.8951, mcherry group n = 6, hM3D group n = 6.
-
I, JELISA results showing serum ACTH (I, two‐tailed unpaired t‐test, t (16) = 1.215, P = 0.2420) and CORT levels (J, two‐tailed unpaired t‐test, t (16) = 1.616, P = 0.1257) after chronically reactivating PVN neurons, mcherry group n = 8, hM3D group n = 10.
Data information: Shapiro–Wilk test and F‐test were used to test the normality and equal variance assumptions, respectively. Two‐tailed t‐tests were performed to assess differences between two experimental groups with normally distributed data and equal variance. Two‐tailed t‐tests with Welch's correction were used when a two‐sample comparison of means with unequal variances. For non‐normally distributed data, Mann–Whitney U‐tests were performed to compare two groups. P < 0.05 was considered statistically significant. *P < 0.05. Data are presented as means ± SEM.
Source data are available online for this figure.
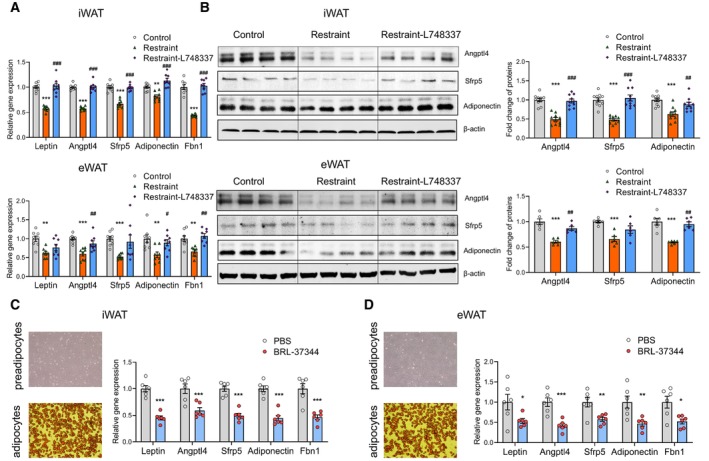
We next explored whether the sympathetic nerve–β‐adrenergic receptor mediated the expression regulation of the adipokines mentioned above under chronic restraint stress. In vivo study showed that blocking the β‐adrenergic receptors by L748337 restored the expression of adipokines to the control level (Fig 9A and B, upper iWAT, lower eWAT). Then, we performed in vitro experiments in adipocytes differentiated from primary preadipocytes. Adipose stem cells/preadipocytes were extracted and differentiated into mature adipocytes (Fig 9C and D, left). We added BRL37344 (a β‐adrenergic receptor agonist) to the culture medium to activate the β‐adrenergic receptors. Real‐time PCR analysis (Fig 9C and D, right) showed that the expression of leptin, adiponectin, Angptl4, Sfrp5 and Fbn1 decreased. Together, our results show that the β‐adrenergic receptor plays an important role in the regulation of adipokine expression involved in depression and insulin resistance under chronic restraint stress.
Figure 9. Activation of β‐adrenergic receptor is required for the regulation of adipokines involved in depression and insulin resistance under chronic restraint stress.
-
A–DReal‐time PCR analysis (A, upper iWAT, lower eWAT) western blotting (B, upper iWAT, lower eWAT) showing blocking the β‐adrenergic receptors by L748337 restored the expression of adipokines to the control level. In vitro experiments showing activating the β‐adrenergic receptors by BRL‐37344 increased the expression of adipokines (C and D). * for restraint vs. control, # for restraint vs. restraint‐L748337 in (A) and B. control group n = 8, restraint group n = 8, restraint‐L748337 group n = 8 in (A); control group n = 10, restraint group n = 10, restraint‐L748337 group n = 10 in (B); vehicle group n = 6, BRL‐37344 group n = 6 in (C) and (D). Shapiro–Wilk test and F‐test were used to test the normality and equal variance assumptions, respectively. Two‐tailed t‐tests were performed to assess differences between two experimental groups with normally distributed data and equal variance. Two‐tailed t‐tests with Welch's correction were used when a two‐sample comparison of means with unequal variances. For three groups with normally distributed data, one‐way analyses of variance (ANOVAs) followed by Tukey's multiple comparisons test were used. For non‐normally distributed data, Mann–Whitney U‐tests were performed to compare two groups, and the Kruskal–Wallis test followed by Dunn's multiple comparisons test was used for analysis of three groups. P < 0.05 was considered statistically significant. *P < 0.05, **P < 0.01, ***P < 0.001; # P < 0.05, ## P < 0.01, ### P < 0.001. Data are presented as means ± SEM.
Source data are available online for this figure.
Roles of AP‐1 proteins in the transcriptional regulation of adipokines
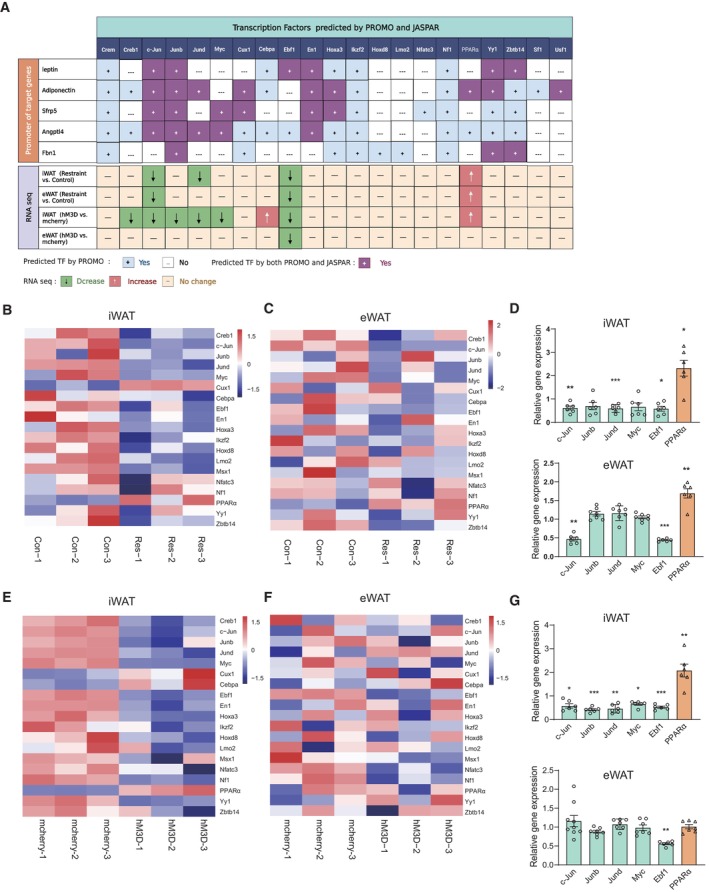
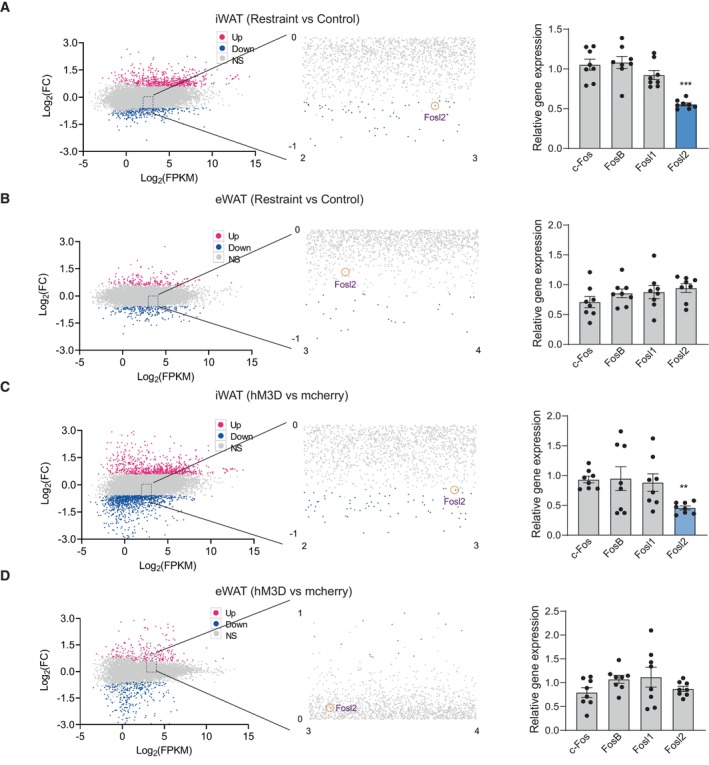
We next explored the underlying molecular mechanism by which chronic restraint stress regulated the expression of these adipokines, leptin, adiponectin, Angptl4, Sfrp5 and fibrillin‐1/asprosin. We analysed the promoters of these genes (from −2,000 to +200) to identify potential transcription factor (TF)‐binding motifs using the online bioinformatics software ALGGEN‐PROMO and JASPAR (Fig 10A). Among the predicted TFs by both PROMO and JASPAR, we focussed on those whose expression changed, including c‐Jun, Junb, Jund, Myc, Ebf1 and PPARα (Fig 10B–G). c‐Jun, Junb and Jund belong to the activator protein‐1 (AP‐1) family, which includes the Jun (c‐Jun, Junb and Jund) and Fos (c‐Fos, Fosl1, Fosl2 and FosB) subfamilies (Shaulian & Karin, 2002; Wagner & Eferl, 2005). The Jun proteins form both homodimers with other Jun‐family members and heterodimers with Fos proteins (Shaulian & Karin, 2002; Wagner & Eferl, 2005), which raised the possibility that the Fos proteins may also be involved in transcriptional regulation of those adipokines mentioned above. RNA‐seq and real‐time PCR analyses showed that the mRNA level of a member of Fos subfamily, Fosl2, decreased in iWAT under chronic stress (Fig 11A) or chronic activation of PVN (Fig 11C), but not changed in eWAT (Fig 11B and D), which made it another transcriptional regulatory candidate for further investigation.
Figure 10. Identification of TF involved in the regulation of adipokines.
-
ADiagram showing the identification of potential transcription factor (TF) which may be involved in the regulation of adipokines under chronic restraint stress and chronic activation of PVN by the online bioinformatics software (ALGGEN‐PROMO and JASPAR) and RNA‐seq data.
-
B–GHeat map showing relative expression levels for the predicted TFs under chronic restraint stress (B and C) or chronic activation of PVN neurons responding to restraint stress (E and F). Real‐time PCR analysis confirmed RNA‐seq results of the predicted TFs (D and G).
Data information: control group n ≥ 6, restraint group n ≥ 6 for Real‐time PCR in (B) and (C); mcherry group n ≥ 6, hM3D group n ≥ 6 for Real‐time PCR in (D) and (G). Shapiro–Wilk test and F‐test were used to test the normality and equal variance assumptions, respectively. Two‐tailed t‐tests were performed to assess differences between two experimental groups with normally distributed data and equal variance. Two‐tailed t‐tests with Welch's correction were used when a two‐sample comparison of means with unequal variances. For non‐normally distributed data, Mann–Whitney U‐tests were performed to compare two groups. P < 0.05 was considered statistically significant. *P < 0.05, **P < 0.01, ***P < 0.001. Data are presented as means ± SEM.
Source data are available online for this figure.
Figure 11. Expression of Fos proteins under chronic restraint stress or chronic activation of PVN neurons.
-
A–DMA‐plot (abundance vs fold change) of significantly downregulated (green) and upregulated (red) genes (fold change ≥ 0.58 and P < 0.05) between the control and restraint group (left, A and B) or mcherry and hM3D group (left, C and D). Real‐time PCR analysis of Fos subfamily (c‐Fos, Fosl1, Fosl2 and FosB) (right, A–D).
Data information: control group n = 8, restraint group n = 8 for Real‐time PCR in (A–D). Shapiro–Wilk test and F‐test were used to test the normality and equal variance assumptions, respectively. Two‐tailed t‐tests were performed to assess differences between two experimental groups with normally distributed data and equal variance. Two‐tailed t‐tests with Welch's correction were used when a two‐sample comparison of means with unequal variances. For non‐normally distributed data, Mann–Whitney U‐tests were performed to compare two groups. P < 0.05 was considered statistically significant. **P < 0.01, ***P < 0.001. Data are presented as means ± SEM.
Source data are available online for this figure.
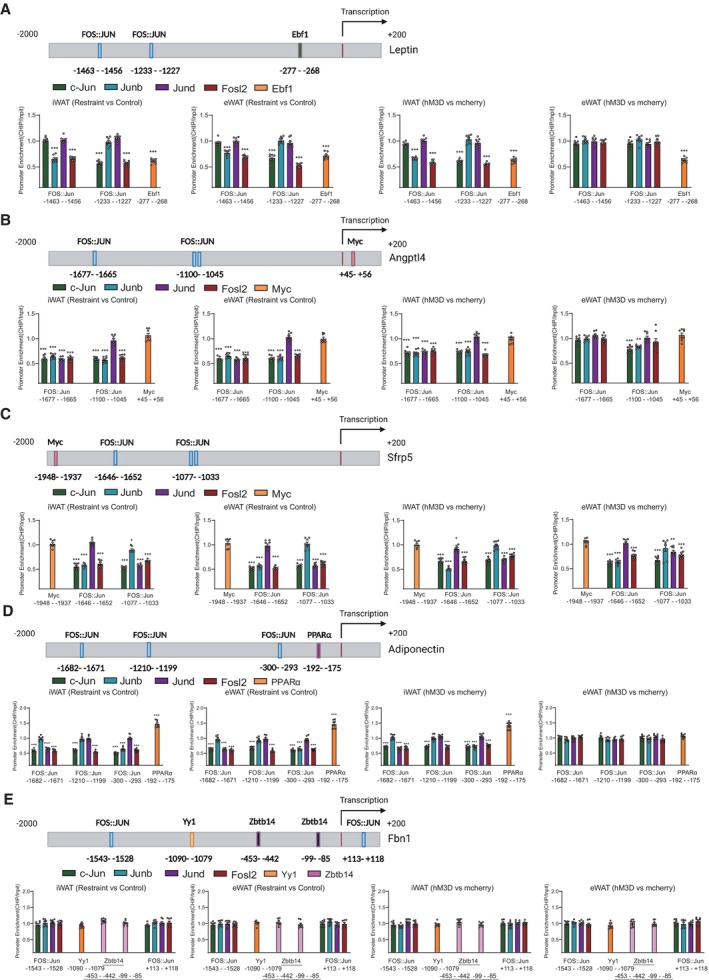
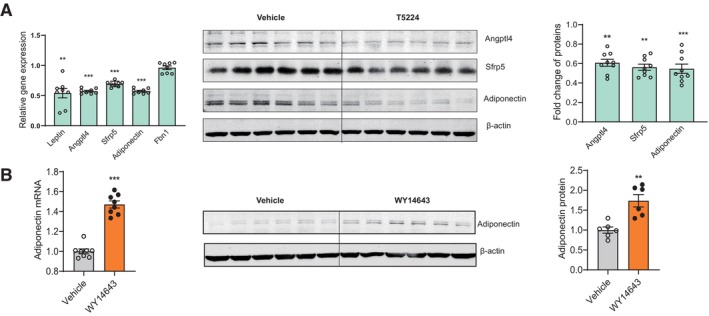
We performed ChIP assays to verify the interaction between those transcriptional regulatory candidates and their predicted binding motifs of target genes in our experimental system. There are two predicted Fos:Jun DNA‐binding motif and one Ebf1 DNA‐binding motif in the promoter region of leptin gene (Fig 12A, upper). The ChIP results showed that the binding of candidate TFs (c‐Jun, Junb, Jund, Fosl2 and Ebf1) to corresponding DNA motifs decreased in both iWAT and eWAT under chronic restraint stress (Fig 12A, lower left), while chronically activating PVN neurons responding to restraint stress achieved similar effect in iWAT, but not in eWAT (Fig 12A, lower right). These ChIP results were consistent with the decreased expression of leptin shown in Figs 7 and 8. In the promoter region of Angptl4, there were two predicted Fos:Jun DNA‐binding motif and one Myc DNA‐binding motif (Fig 12B, upper). The ChIP results showed that the binding of AP‐1 proteins (c‐Jun, Junb, Jund and Fosl2) to corresponding DNA motifs decreased in both iWAT and eWAT under chronic restraint stress (Fig 12B, lower left) and chronically activating PVN neurons achieved similar effect in iWAT and eWAT (Fig 12B, lower right). These ChIP results may explain the decreased expression of Angptl4 shown in Figs 7 and 8. For Sfrp5, the binding of AP‐1 proteins (c‐Jun, Junb, Jund and Fosl2) to corresponding DNA motifs (Fig 12C, upper) decreased in both iWAT and eWAT, under chronic restraint stress (Fig 12C, lower left) or chronically activating the PVN neurons (Fig 12C, lower right), along with decreased expression of Sfrp5 (Figs 7 and 8). There are three predicted Fos:Jun DNA‐binding motif and one PPARα DNA‐binding motif in the promoter region of adiponectin gene (Fig 12D, upper). The binding of AP‐1 proteins (c‐Jun, Junb, Jund and Fosl2) to corresponding DNA motifs decreased in both iWAT and eWAT, while the binding of PPARα increased (Fig 12D, lower left), under chronic restraint stress. Chronically activating PVN neurons achieved similar effect in iWAT, but not in eWAT (Fig 12D, lower right). Under chronic restraint stress, the expression of adiponectin decreased in both iWAT and eWAT (Fig 7), which indicated that the decreased binding of AP‐1 proteins played a significant role in the expression regulation of adiponectin under stress. While chronically activating the PVN neurons, the expression of adiponectin increased in iWAT (Fig 8), which indicated that the increased binding of PPARα served more important role than AP‐1 proteins in the expression regulation of adiponectin in this situation. As shown in Fig 12E, the binding of predicted TFs on the promoter of Fbn1 gene did not change. Overall, the recruitment of the AP‐1 family members (c‐Jun, Junb, Jund and fosl2) and Ebf1 to the predicted DNA motifs decreased, while that of PPARα increased, under chronic restraint stress or chronic activation of PVN neurons, indicating the potential roles of the predicted TFs in regulating the expression of those adipokines. We next performed in vitro experiments to further address this possibility. Our results showed that T‐5224, which inhibits the binding activity of AP‐1 to the DNA motifs, decreased the expression of leptin, adiponectin, Angptl4 and Sfrp5 (Fig 13A). WY14643, a PPARα agonist, which augments the recruitment of PPARα to the predicted PPAR response element (PPRE), increased the expression of adiponectin (Fig 13B). Collectively, the expression of AP‐1 family members (c‐Jun, Junb, Jund and fosl2) decreased in our experimental system, inducing downregulation of binding to their corresponding DNA motifs and subsequent decreases in the expression of target genes. In contrast, the expression of PPARα increased, resulting in augmented recruitment of PPARα to PPRE and thus enhancing the transcription of adiponectin.
Figure 12. Binding of AP‐1 proteins to the promoters of adipokines under chronic restraint stress or chronic activation of PVN neurons.
-
A–EChIP assays showing the binding of AP‐1 family members (c‐Jun, Junb, Jund and fosl2), Ebf1, PPARα, Yy1 and Myc to the promoters of adipokines (A, leptin; B, Angptl4; C, Sfrp5; D, adiponectin; E, Fbn1) under chronic stress or chronically activating PVN neurons.
Data information: N = 8 for each group in (A–E). Shapiro–Wilk test and F‐test were used to test the normality and equal variance assumptions, respectively. Two‐tailed t‐tests were performed to assess differences between two experimental groups with normally distributed data and equal variance. Two‐tailed t‐tests with Welch's correction were used when a two‐sample comparison of means with unequal variances. For non‐normally distributed data, Mann–Whitney U‐tests were performed to compare two groups. P < 0.05 was considered statistically significant. *P < 0.05, **P < 0.01, ***P < 0.001. Data are presented as means ± SEM.
Source data are available online for this figure.
Figure 13. Roles of AP‐1 proteins in the transcriptional regulation of adipokines.
-
A, BIn vitro experiments showing that inhibiting the binding activity of AP‐1 proteins induced decreased expression of leptin, adiponectin, Angptl4 and Sfrp5, but did not influence the expression of Fbn1 (A), and augmenting the recruitment of PPARα to PPRE increased the expression of adiponectin (B).
Data information: n ≥ 6 for each group in (F) and (G). Shapiro–Wilk test and F‐test were used to test the normality and equal variance assumptions, respectively. Two‐tailed t‐tests were performed to assess differences between two experimental groups with normally distributed data and equal variance. Two‐tailed t‐tests with Welch's correction were used when a two‐sample comparison of means with unequal variances. For non‐normally distributed data, Mann–Whitney U‐tests were performed to compare two groups. P < 0.05 was considered statistically significant. **P < 0.01, ***P < 0.001. Data are presented as means ± SEM.
Source data are available online for this figure.
Discussion
The comorbidity of depression and insulin resistance is a major challenge for health care worldwide, as the outcomes of both conditions are worsened by the other. Previous studies have focussed on the direction of association between depression and insulin resistance and provided evidence for a bidirectional association (Stuart & Baune, 2012; Moulton et al, 2015). Recently, many researchers have made increasing efforts to uncover the shared biological pathways that may simultaneously predispose patients to both depression and insulin resistance. With this shift, researchers aim to find mechanisms common to the development of both depression and insulin resistance and thereby improve treatment and preventative strategies. Prior studies have suggested some common mechanisms, including HPA axis dysfunction, chronic inflammation and autonomic dysfunction (Gangwisch, 2009; Stetler & Miller, 2011; Courtet & Olié, 2012; Holt et al, 2014; Mahar et al, 2014; Westfall et al, 2021; Wu et al, 2021).
WAT, receiving sympathetic nerve intervention, is not only the major site of energy storage but also an active endocrine organ. A large number of protein factors are released by adipocytes, which are termed adipokines. Adipokines signal the functional status of adipose tissue to targets in the brain, muscle, liver, pancreas, immune system, vasculature, heart and other organs and tissues, contributing to the regulation of appetite and satiety, fat distribution, insulin sensitivity, energy expenditure, endothelial function, blood pressure, haemostasis, mood regulation and cognitive performance. Dysregulation of adipokines has been implicated in insulin resistance, depression, anxiety, cardiovascular disease and inflammation (Fasshauer & Blüher, 2015; Romere et al, 2016; Chen et al, 2018; Petersen & Shulman, 2018; Lee et al, 2019). The most prominent and abundant adipokines are leptin and adiponectin. Leptin is involved in the regulation of appetite, angiogenesis, insulin sensitivity, depression, anxiety and cognition (Zhang & Chua Jr, 2017), while adiponectin has insulin‐sensitizing, antidepressant, antidiabetic, antiatherogenic, anti‐inflammatory and angiogenic properties (Fang & Judd, 2018). Within the past few years, more newly discovered adipokines have been found to participate in the regulation of insulin sensitivity, such as chemerin, RBP4, omentin, Nampt, Angptl4, Sfrp5, asprosin and Fgf21 (Fasshauer & Blüher, 2015; Romere et al, 2016; Chen et al, 2018; Petersen & Shulman, 2018; Lee et al, 2019; Gonzalez‐Gil & Elizondo‐Montemayor, 2020; Sepandar et al, 2020; Yuan et al, 2020). Therefore, alterations in adipokine secretion may link WAT dysfunction to both depression and insulin resistance.
Diverse and chronic stresses disturb the internal homeostasis of organs and tissues. Long‐term disturbance of homeostasis has been implicated in various disease states, including depression, neurodegenerative disorders, metabolic syndrome, insulin resistance, diabetes and cardiovascular diseases (Chrousos, 2009; Joseph & Golden, 2017; Branyan et al, 2018; Kostov & Halacheva, 2018; Amadio et al, 2020; Price & Duman, 2020). In our study, chronic restraint stress induced both depressive‐like behaviours and insulin resistance (Fig 1B–G). Next, we examined whether the adipose tissue endocrine function changed and what candidates may be responsible for the development of depression and insulin resistance under chronic stress. Our previous research has shown that decreased expression of adiponectin in WAT under chronic stress is responsible for the cognitive dysfunction associated with depression (You et al, 2021). In this study, our data showed that the expression of several adipokines related to depression and insulin resistance changed, including leptin, adiponectin, Angptl4, Sfrp5 and fibrillin‐1/asprosin (Fig 7A–D). Previous studies have reported that brain leptin levels are significantly lower in depressive patients than in healthy controls, which coincides with the antidepressant effects of leptin in animal models of depression (Eikelis et al, 2006; Ge et al, 2018). Both people with congenital leptin deficiency and leptin‐deficient ob/ob mice exhibit severe insulin resistance, while leptin administration improves whole‐body insulin sensitivity (Moon et al, 2013; Chaurasia et al, 2021). Adiponectin levels decrease in patients with depression (Hara et al, 2002), and adiponectin haploinsufficiency has been found to increase susceptibility to stress‐induced depression in a mouse model (Liu et al, 2012). Adiponectin has emerged as a potential therapy for T2DM, as it can increase the insulin sensitivity of liver and skeletal muscle (Lin et al, 2013). In addition to leptin and adiponectin, more recently discovered adipokines, Angptl4, Sfrp5 and asprosin, have been shown to be associated with energy homeostasis and insulin resistance. The levels of circulating Sfrp5 are significantly lower in insulin‐resistant patients than in healthy controls, and Sfrp5−/− mice display significant impairment in insulin sensitivity compared with that of wild‐type (WT) mice under high‐fat/high‐sucrose feeding conditions (Ouchi et al, 2010; Hu et al, 2013). Xu et al (2005) have reported that serum Angptl4 levels are significantly decreased in patients with T2DM and that Angptl4 markedly improves insulin sensitivity in a diabetic mouse model. However, another study shows that Angptl4 plays a required role in glucocorticoid‐induced insulin resistance by promoting lipolysis in WAT (Chen et al, 2017). Previous studies have shown that asprosin levels are elevated in mice and human with insulin resistance and that intraperitoneal injection of asprosin deteriorates insulin sensitivity and glucose tolerance (Duerrschmid et al, 2017; Yuan et al, 2020). Further investigation is needed to illuminate their respective roles. The depressive‐like behaviours and insulin resistance are probably due to the combined effects of those adipokines under chronic stress.
We further explored the biological pathway by which chronic restraint stress regulated the expression of these adipokines and subsequently induced depression and insulin resistance. Previous studies have shown that adipose tissue function is organized by the central nervous system through the regulation of sympathetic activity, including tissue homeostasis, lipolysis, thermogenesis and endocrine responses to various conditions (Zeng et al, 2015; Ryu & Buettner, 2019; Wang et al, 2021). In our study, chronic restraint stress increased sympathetic innervation in both iWAT and eWAT (Fig 1H and I). We next investigated which brain regions regulated sympathetic outflow into WAT under chronic restraint stress. To address this issue, we performed retrograde polysynaptic tracing by injecting PRV encoding enhanced green fluorescent protein (EGFP) or monomeric red fluorescent protein (mRFP) into iWAT or eWAT, respectively (Figs 2 and 3). The PVN was labelled by EGFP or mRFP from iWAT or eWAT on the 4th day after PRV injection (Fig 4B and C). Furthermore, we observed that the vast majority of those labelled cells were activated by restraint stress (Figs 4B and C, and EV1). Then, we assessed the roles of PVN neurons activated by restraint stress for adipokine expression and subsequent depression and insulin resistance using chemogenetic technology. We specifically expressed the excitatory hM3D in PVN‐activated neurons by restraint stress in Fos‐CreERT2 mice. Repeatedly activating the labelled PVN neurons increased sympathetic innervation (Fig 4E and F) and achieved similar effects on the regulation of the expression of those adipokines, while the adiponectin was unchanged in eWAT, even increased in iWAT (Fig 8A–D). Our data showed that chronic restraint stress increased the serum level of CORT (Fig EV5E), end‐hormones of HPA axis, which inhibited the expression of adiponectin (Dang et al, 2017; Kaikaew et al, 2019). In the PVN activation paradigm, there was no significant difference in the serum level of CORT (Fig EV5J). Taken together, increased CORT may play an important role in the downregulation of adiponectin under chronic restraint stress.
The hM3D group mice displayed impaired insulin sensitivity and susceptibility to stress‐induced depressive‐like behaviours (Fig 4G–L). Inhibiting PVN neurons responding to restraint through the CNO/hM4D system blocked the effect of chronic restraint stress on sympathetic innervation (Fig 5B and C). Both the depressive‐like behaviours and insulin resistance induced by chronic restraint stress were all ameliorated in the hM4D group (Fig 5D–I). The PV was activated by restraint stress, but not traced by PRV from WAT (Fig EV3A–F). Chronically activating the PV with the same viral approach than the PVN (Fig EV3G and H) did not affect the sympathetic innervation in WAT (Fig EV3I–L) or induce depressive‐like behaviours and insulin resistance (Fig EV4). These results highlighted the importance of PVN in the increased sympathetic innervation, depressive‐like behaviours and insulin resistance induced by chronic restraint stress. It is indicated that there are several neuron types in the PVN that respond to stress, including preautonomic neurons and corticotropin‐releasing hormone (CRH) neurons. The HPA axis activity is initiated through releasing CRH response to stress. The end‐hormones of HPA axis, CORT, are involved in the occurrence and development of depression and insulin resistance (Herman et al, 2016; Jiang et al, 2019). Our results showed that chronic restraint treatment increased the serum CORT level (Fig EV5E), which may account for the downregulation of adiponectin. Taken together, these data suggested that both autonomic and neuroendocrine compartments of PVN were involved in mediating the effects of chronic restraint stress.
Furthermore, in vivo (Fig 9A and B) and in vitro (Fig 9C and D) pharmacological experiments suggested that the β‐adrenergic receptor translated the sympathetic signal into intracellular responses under chronic restraint stress. Together, these data delineate a brain–adipose circuit, the PVN–sympathetic nerve–β‐adrenergic receptor pathway, that serves an important role in the depression and insulin resistance induced by chronic stress.
We further explored the intracellular molecular mechanism by which these adipokines were regulated in WAT under chronic restraint stress. Based on the RNA‐seq data and the predictions of the online bioinformatics software (ALGGEN‐PROMO and JASPAR), we identified several potential TFs for further investigation, including c‐Jun, Junb, Jund, fosl2, Myc, Ebf1 and PPARα (Figs 10 and 11). The ChIP–qPCR results confirmed the interactions between these potential TFs and their predicted binding motifs in target genes. More importantly, the results showed the changed strength of TF–DNA interactions, indicating their potential roles in the regulation of target gene expression in our experimental system (Fig 12A–E). The binding of AP‐1 family members (c‐Jun, Junb, Jund and fosl2) and Ebf1 to the predicted DNA motifs decreased, while that of PPARα increased, under chronic restraint stress or chronic activation of PVN neurons. To clarify the effects of TFs on the regulation of adipokine expression, we performed pharmacological experiments in cultured primary adipose cells. Our results demonstrated that inhibiting the binding activity of AP‐1 proteins resulted in decreased expression of leptin, adiponectin, Angptl4 and Sfrp5 (Fig 13A), while augmenting the binding of PPARα to the predicted PPAR response element increased the expression of adiponectin (Fig 13B). Fretz et al's study showed that Ebf1 knockout induces decreased expression of leptin in eWAT but not in iWAT (Fretz et al, 2010). This research indicates that Ebf1 may participate in the downregulation of the expression of leptin, especially in eWAT, when repeatedly activating PVN neurons responding to restraint stress. Collectively, these data suggest that the AP‐1 proteins (Jun, Junb, Jund and Fosl2) play large roles in the downregulation of those adipokines, while Ebf1 collaborates to regulate the expression of leptin and PPARα antagonizes the decrease in adiponectin.
In conclusion, our data provide strong evidence that the PVN neurons responding to restraint stress are involved in sympathetic innervation of WAT under chronic stress and suggest that increased sympathetic innervation in WAT is correlated with alterations in adipokine secretion, depressive‐like behaviours and insulin resistance. Our results identify a brain–adipose circuit, the PVN–sympathetic nerve–β‐adrenergic receptor pathway, that translates stress stimuli into the adipocyte response, and clarify the intracellular molecular mechanism by which the expression of adipokines is regulated. This study not only suggests that dysfunction of WAT endocrine function serves as a common pathogenesis for depression and insulin resistance induced by chronic stress but also describes the panoramic dynamic changes that occur from brain to adipose tissue, providing potential intervention targets for improving prevention and treatment.
Materials and Methods
Mice
C57BL/6J male mice were purchased from Pengyue laboratory (Jinan, China), and Fos‐CreERT2 mice (021882) were purchased from the Jackson laboratory. The mice were housed in a temperature and humidity‐controlled animal facility, which was maintained on a 12 h light/dark cycle, food and water were given ad libitum. The protocols of animal studies were approved by the Institutional Animal Care and Use Committee of Binzhou Medical University Hospital (20210808‐1), and performed in compliance with the National Institutes of Health Guide for the Care and Use of Laboratory Animals. All efforts were made to minimize animal suffering and the number of animals used.
Drugs and antibody
The following primary antibodies were used: c‐Fos (CST, #2250); TH (Merck, AB152); Angptl4 (Thermo Scientific; 40‐9800); Sfrp5(Novus, NBP2‐20331); adiponectin (R&D Systems, AF1119); c‐Jun (CST, #9165); Junb (Santa cruz, sc‐8051); Jund (Merck, HPA063029); Fosl2 (Merck, MABS1261); Myc (Santa cruz, sc‐40); Ebf1 (CST, #50752); PPARα (Rockland, 600‐401‐421); zbtb14 (Novus, NBP2‐57846); Yy1 (Santa cruz, sc‐7341); CRH (abcam, ab272391); and β‐Actin (CST, #4970). The used secondary antibodies used, including Alexa Fluor 546, Goat anti‐Rabbit (A‐11035, Life Technologies); Alexa Fluor 488, Goat anti‐Rabbit (A‐11008, Life Technologies); IRDye® 800CW Donkey anti‐Goat IgG (925‐32214, LI‐COR Biosciences); and IRDye® 800CW Donkey anti‐Rabbit IgG (925‐32213, LI‐COR Biosciences). WY14643 was purchased from Abcam (ab141142) and dissolved in DMSO to a storage solution of 100 mM; L748337 was purchased from Tocris Bioscience (#2760) and dissolved in DMSO to a storage solution of 50 mM; BRL‐37344 was purchased from Santa cruz (sc‐200154) and dissolved in distilled water to a storage solution of 100 mM; T5224 was purchased from MCE (HY‐12270) and dissolved in DMSO to a storage solution of 100 mM. All drugs would be further diluted to the desired final concentration.
Stereotaxic surgery
Before microinjection of virus, mice were anaesthetized and mounted onto a stereotaxic frame (KOPF, USA). For retrograde labelling of neurons in the brain, an incision was made above the thigh to expose iWAT or above the hypogastrium region to expose eWAT. PRV‐CAG‐EGFP or PRV‐CAG‐mRFP (BrainVTA, China) was bilaterally injected into iWAT (each side: 0.2 μl/locus, 1.6 μl total) or eWAT (each side: 0.2 μl/locus, 1.6 μl total), respectively. AAV‐DIO‐hm3D‐mcherry, AAV‐DIO‐hm4D‐mcherry and AAV‐DIO‐mcherry were purchased from Shanghai Hanheng Biotechnology, China. These viruses were injected bilaterally into PVN (coordinate: AP −0.80 mm, ML ± 0. 25 mm, DV −4.90 mm; flow rate of 0.10 μl/min and total volume of 0.50 μl (0.25 μl/side)).
Western blot assay
Mice were decapitated rapidly and adipose tissue was quickly dissected. Adipose tissue was lysed in lysis buffer (Beyotime, P0013B) and centrifuged at 10,000 g for 20 min at 4°C. The supernatant beneath lipid was collected and subjected to western blotting. Images were captured and quantitatively analysed with Odyssey Sa Quantitative Infrared Imaging System (LI‐COR Biosciences).
ELISA
Mice were decapitated rapidly, and trunk blood was transferred to 1.5 ml tube containing 20 μl of 0.5% EDTA and then centrifuged at 3,000 g for 5 min at 4°C. The supernatant was transferred to a new 1.5 ml tube and stored at −80°C. Serum Leptin, ACTH and CORT were determined by ELISA method according to the manufacturer's instructions. Mouse ACTH ELISA Kit (Elabscience, E‐EL‐M0079c), QuicKey Pro Mouse CORT ELISA Kit (Elabscience, E‐OSEL‐M0001), Mouse Leptin/LEP ELISA Kit (BOSTER Biological Technology, EK0438).
FFA detection
Mice were decapitated rapidly, and trunk blood was transferred to 1.5 ml tube containing 20 μl of 0.5% EDTA and then centrifuged at 3,000 g for 5 min at 4°C. The supernatant was transferred to a new 1.5 ml tube and stored at −80°C. Serum FFA contents were quantified using a free fatty acid kit according to the manufacturer's instructions (Solarbio Life Science, BC0595).
qRT–PCR
Total RNA from the WAT (iWAT or eWAT) or hypothalamus was extracted with TRIzol (Thermo scientific, Cat: 15596018) and was reverse transcripted into cDNA using RevertAid First Strand cDNA Synthesis Kit (Thermo Scientific™, Cat: K1622). qRT–PCR was performed using the AceQ qPCR SYBR Green Master Mix (Vazyme Biotech, Cat: Q141‐02) and StepOnePlus™ Real‐Time PCR System (Applied Biosystems). The primer sequences used for qRT–PCR were as follows: leptin, forward‐5′‐AAGGGGCTTGGGTTTTTCCA‐3′, reverse‐5′‐CAGACAGAGCTGAGCACGAA‐3′; Angptl4, forward‐5′‐AGCTCATTGGCTTGACTCCC‐3′, reverse‐5′‐GAAGTCCACAGAGCCGTTCA‐3′; Sfrp5, forward‐5′‐CTGGACAACGACCTCTGCAT‐3′, reverse‐5′‐TCGGTCCCCGTTGTCTATCT‐3′; adiponectin, forward‐5′‐CAGGCATCCCAGGACATCC‐3′, reverse‐5′‐CCAAGAAGACCTGCATCTCCTTT‐3′; Fbn1, forward‐5′‐CCGAGTGCAAGCAGTAGGTT‐3′, reverse‐5′‐AGCACCATTACAAACCCTCACA‐3′; c‐Jun, forward‐5′‐GGGAGCATTTGGAGAGTCCC‐3′, reverse‐5′‐TTTGCAAAAGTTCGCTCCCG‐3′; Junb, forward‐5′‐AGGCAGCTACTTTTCGGGTC‐3′, reverse‐5′‐GCGTCACGTGGTTCATCTTG‐3′; Jund, forward‐5′‐TACGCAGTTCCTCTACCCGA‐3′, reverse‐5′‐AAACTGCTCAGGTTGGCGTA‐3′; Fosl2, forward‐5′‐ATCCCCACAATCAACGCCAT‐3′, reverse‐5′‐TCTCTCCCTCCGGATTCGAC‐3′; Fosl1, forward‐5′‐TCATCTGGAGAGGTGGGTCC‐3′, reverse‐5′‐CCCGTAGTCTCGGTACATGC‐3′; FosB, forward‐5′‐AGCTAAGTGCAGGAACCGTC‐3′, reverse‐5′‐ACTTGAACTTCACTCGGCCA‐3′; c‐Fos, forward‐5′‐TACTACCATTCCCCAGCCGA‐3′, reverse‐5′‐GCTGTCACCGTGGGGATAAA‐3′; Myc, forward‐5′‐CGACTACGACTCCGTACAGC‐3′, reverse‐5′‐GTAGCGACCGCAACATAGGA‐3′; Ebf1, forward‐5′‐TGGAACATGCAGCTACTCCC‐3′, reverse‐5′‐GTGTCTGAACTCGGATGGCA‐3′; PPARα, forward‐5′‐TGCCTTCCCTGTGAACTGAC‐3′, reverse‐5′‐TGGGGAGAGAGGACAGATGG‐3′; CRH, forward‐5′‐CAACCTCAGCCGGTTCTGAT‐3′, reverse‐5′‐GGAAAAAGTTAGCCGCAGCC‐3′; β‐Actin, forward‐5′‐AGCCATGTACGTAGCCATCC‐3′, reverse‐5′‐TGTGGTGGTGAAGCTGTAGC‐3′. The housekeeping gene β‐tubulin was used as a reference gene for normalization of gene expression, and the 2−ΔΔCt method was used to calculate the relative gene expression (Livak & Schmittgen, 2001).
Chromatin immunoprecipitation (ChIP)
Mice were decapitated rapidly, and iWAT or eWAT was collected and chopped into small chunks with fine scissors and then transferred to a 5 ml tube (iWAT or eWAT of one mice/one tube). Adding 4 ml ice‐cold PBS containing 1% formaldehyde and added 250 μl glycine solution (2 M) 15 min later. Washing with ice‐cold PBS and transferring WAT to a new 5 ml tube. Adding 4 ml nuclear lysis buffer and homogenizing on ice, centrifuging at 10,000 g for 5 min at 4°C. Transferring the supernatant beneath lipid to a new 5 ml tube and getting DNA fragments using ultrasonication. Cross‐linked chromatin was immunoprecipitated with antibodies (c‐Jun, Junb, Jund, Fosl2, Myc, Ebf1, PPARα, zbtb14 and Yy1) and the immunoprecipitated samples were subsequently subjected to qPCR. The primer sequences used were as follows: leptin, Fos::Jun (−1,463 – −1,456): forward‐5′‐GCATCCGCTAGAAAGTCCCA‐3′, reverse‐5′‐CCGGCTGTGCACTTCACTAT‐3′; Fos::Jun (−1,233 – −1,227): forward‐5′‐AGCAGGGCCTATGCAAAACA‐3′, reverse‐5′‐CCCGTCTCTTATGGGCGTTC‐3′; Ebf1 (−277 – −268): forward‐5′‐CCTCTGAGCAGCCAGGTTAG‐3′, reverse‐5′‐GCGGTAGTTTAAGGACGGGT‐3′. Angptl4, Fos::Jun (−1,677 – −1,665): forward‐5′‐GCCTTGAGGCATGCAGTTTC‐3′, reverse‐5′‐AAGCCTGGCACAGAAAACCT‐3′; Fos::Jun (−1,100 – −1,045): forward‐5′‐GACTGTTTTAAATTGTGTGC‐3′, reverse‐5′‐GTGAAGTTCCAGGCCATCCA‐3′; Myc (+45 – +56): forward‐5′‐CGTCCTGATTTGTACGCCCT‐3′, reverse‐5′‐CAAGGCAGAAGTTTGCCCAC‐3′. Sfrp5, Fos::Jun (−1,646 – −1,652): forward‐5′‐GTAGTTGGGAAAGAGGGGGC‐3′, reverse‐5′‐GGGATGGGATGCCTCTGATG‐3′; Fos::Jun (−1,077 – −1,033): forward‐5′‐CTGCTTGGAGGACAGAAGCA‐3′, reverse‐5′‐GGATTTGGAGACGTGGGGTT‐3′; Myc (−1,948 – −1,937): forward‐5′‐CTCGTCCCTGTGAGCATCTG‐3′, reverse‐5′‐GCCCCCTCTTTCCCAACTAC‐3′. adiponectin, Fos::Jun (−1,682 – −1,671): forward‐5′‐GCCTTGGGTCTGTGTCTCTC‐3′, reverse‐5′‐GGAGCAGGGGCTTTACCTAC‐3′; Fos::Jun (−1,210 – −1,199): forward‐5′‐TGGGGTCACAACTAACAGCC‐3′, reverse‐5′‐CCAAGCATCTGCTTCCTCCA −3′; Fos::Jun (−300 – −293): forward‐5′‐ATGCCTGAACCACACAGCTT‐3′, reverse‐5′‐ACCTCCCTTTCCCATAAGTT‐3′; PPARα (−192 – −175): forward‐5′‐GAGGTCTCCTGACCCCTGAA‐3′, reverse‐5′‐TTCCAGGCTTTGGCCATTCT‐3′. Fbn1, Fos::Jun (−1,543 – −1,528): forward‐5′‐ATCATCTAAGCAGTGCCCCG‐3′, reverse‐5′‐GGCCCACGGATGAATCAGAA‐3′; Fos::Jun (+113 – +118): forward‐5′‐ATGTAAGCACCAGGAGAAGA‐3′, reverse‐5′‐CTAGGTCACATTTTAGAAAT‐3′; Yy1 (−1,090 – −1,079): forward‐5′‐TGAGGCGTGGTCCATTTTGA‐3′, reverse‐5′‐CAGGGACTCCAGTCACCAAC‐3′; zbtb14(−453 – −442): forward‐5′‐CCAGACAGCAGAAGACTGGG‐3′, reverse‐5′‐CGAGATTCCCGCGATCAGAA‐3′; zbtb14(−99 – −85): forward‐5′‐GATCCTGCGAATGAGGGAGG‐3′, reverse‐5′‐CAGTCTCTGCCCCAACTCTG‐3′.
Immunostaining
Mice were anaesthetized and transcardially perfused with cold PBS and 4% paraformaldehyde (PFA) sequentially, and then brain were collected. Coronal sections (40 μm) containing the target brain region were obtained using a freezing microtome (Leica, CM1950). After immunostaining with the antibody c‐Fos (CST, #2250), images were captured by the Olympus FV10 confocal system (Olympus). The immunopositive cells were counted manually by experimenters who were blind to the treatments.
Whole‐mount immunostaining and clearing of adipose tissue
Mice were anaesthetized and transcardially perfused with cold PBS and 4% paraformaldehyde (PFA) sequentially. All harvested samples were maintained in 4% PFA at 4°C overnight. Adipose tissue immunostaining and clearing was performed with slightly modified protocol as described previously (Chi et al, 2018). Briefly, adipose tissue was washed in ice‐cold PBS for 1 h first and subsequently processed through dehydration, delipidation and permeabilization. Following 6‐day incubation with primary anti‐TH antibodies (1:600; Merck, AB152), adipose tissue was further stained with secondary antibodies (Alexa Fluor 546) for another 5 days. After an overnight clearing step in dibenzyl ether (DBE; Sigma‐Aldrich, Cat: 33630), adipose tissue samples were imaged on the light‐sheet microscopy (LS18, Nuohai, Shanghai, China), and subsequent 3D reconstruction and analysis were performed with Imaris software.
Sucrose preference test (SPT)
Mice were habituated to drinking water from two bottles for 1 week before beginning testing. Mice had free choice of either drinking 1% sucrose solution or water for the first 2 h of the dark cycle. Sucrose preference was calculated as the ratio of the mass of sucrose consumed versus the total mass of sucrose and water consumed during the test.
Female urine sniffing test (FUST)
The female urine sniffing test was used to assess sex‐related reward‐seeking behaviour and performed as previously described (Malkesman et al, 2010). On the experimental day, male mice were subjected to the following test procedure: 1. 3‐min exposure to the cotton tip dipped in water; 2. 45‐min interval; and 3. 3‐min exposure to the cotton tip infused with fresh urine from female mice in the oestrus phase. The duration of female urine sniffing time was scored by experimenters who were blind to treatments.
Forced swim test (FST)
The Plexiglas cylinder used for this test was 25 cm high and 10 cm in diameter. Each mouse was placed in a Plexiglas cylinder with water at a 15 cm depth (24°C) for 6 min, which was recorded by a camera directly above. The duration of immobility during the last 4 min was measured by experimenters who were blind to treatments. Immobility was defined as no movements except those that maintain their head above water for respiration.
Locomotor activity
This test was performed in SuperFlex open field cages (40 × 40 × 30 cm, Omnitech Electronics Inc., Columbus, OH), and mice were allowed to freely explore for 30 min. The total distance travelled was quantified using Fusion software (Omnitech Electronics Inc., Columbus, OH).
Glucose tolerance test (GTT)
This test was used to detect pathological changes in glucose metabolism which are associated with diabetes and metabolic disease. After 16 h of fasting, about 5 μl blood from the tail vein was collected, and the glucose concentration was monitored with glucose test strip representing baseline (time = 0, fasting blood glucose). Then, mice received intraperitoneal injection of 20% glucose (2 g glucose/kg). Routinely, blood glucose concentrations were measured at 30, 60, 90 and 120 min after glucose administration.
Insulin tolerance test (ITT)
This test was used to measure the insulin sensitivity. After 4 h of fasting (from 9 am to 1 pm), blood from the tail vein was collected and measured (time = 0, baseline). Subsequently, mice were injected with the diluted insulin (0.5 U/kg) and blood glucose concentration was measured at 15, 30, 60, 90 and 120 min after insulin injection.
Primary adipocyte culture and chemical treatment
The stromal vascular fraction (SVF), containing adipose stem cells/preadipocytes, was isolated from iWAT or eWAT as previously described (Aune et al, 2013; Poret et al, 2021). Briefly, iWAT or eWAT of 8–10 weeks C57BL/6J male mice was collected quickly and chopped into small chunks in ice‐cold PBS. Adipose tissue was digested with Collagenase D (1.5 U/ml, Roche, Cat: 11088858001) and Dispase II (2.4 U/ml, Sigma‐Aldrich, Cat: D4693) at 37°C for 1 h. The digestions were stopped with DMEM/F12 containing 10% FBS and centrifuged at 1,000 g for 10 min. The precipitation pellet was SVF. Resuspended the pellet and filtered through 70‐μm filters (Beyotime, FSTR070). Subsequently, transferred the filtrate to culture dish with DMEM/F12 containing 10% FBS. 3–4 days later, changed the medium to induction medium (DMEM (high glucose), 10% FBS, indomethacin (125 μM), dexamethasone (2 μg/ml), 3‐Isobutyl‐1‐methylxanthine (0.5 mM), Rosiglitazone (1 μM), insulin (10 μg/ml)). Changed the induction medium every 3 days. About 18 days later, preadipocytes were fully differentiated to mature fat cells (oil red staining (Solarbio Life Science, G1262), Fig 9C and D). Changed the medium to DMEM (high glucose) containing 10% FBS and added WY14643(final concentration in culture medium, 1 μM), BRL‐37344 (final concentration in culture medium, 1.5 μM) or T5224(final concentration in culture medium, 5 μM). Forty‐eight hours later, collected the cell for subsequent experiments.
RNA‐Seq
Total RNA was extracted from iWAT or eWAT using TRIzol reagent according to the manufacturer's instructions for Illumina sequencing. mRNA was isolated using the poly‐T oligo‐attached magnetic beads prior to RNA‐seq library preparation. The gene expression and changes were analysed using StringTie. MA‐plot analyses and heat map of gene expression levels were performed using the OmicShare tools (https://www.omicshare.com/tools) and BMK Cloud (www.biocloud.net).
Statistical analyses
Statistical analysis was performed with GraphPad Prism software. Data are presented as mean ± standard error of mean (S.E.M.). Shapiro–Wilk test and F‐test were used to test the normality and equal variance assumptions, respectively. Two‐tailed t‐tests were performed to assess differences between two experimental groups with normally distributed data and equal variance. Two‐tailed t‐tests with Welch's correction were used when a two‐sample comparison of means with unequal variances. For three or more groups with normally distributed data, one‐way analyses of variance (ANOVAs) followed by Tukey's multiple comparisons test were used. For non‐normally distributed data, Mann–Whitney U‐tests were performed to compare two groups, and the Kruskal–Wallis test followed by Dunn's multiple comparisons test was used for analysis of three or more groups. For multiple groups, two‐way ANOVAs followed by Sidak multiple comparisons test were used. P < 0.05 was considered statistically significant.
Author contributions
Bin Liu: Conceptualization; data curation; formal analysis; supervision; funding acquisition; writing – original draft; writing – review and editing. Jing Wang: Formal analysis; investigation; methodology. Linshan Sun: Formal analysis; investigation; methodology. Jingjing You: Funding acquisition; investigation; methodology. Honghai Peng: Investigation; methodology. Haijing Yan: Funding acquisition; investigation; methodology. Jiangong Wang: Investigation; methodology. Fengjiao Sun: Investigation; methodology. Minghu Cui: Investigation; methodology. Sanwang Wang: Investigation; methodology. Zheng Zhang: Investigation; methodology. Xueli Fan: Funding acquisition; investigation; methodology. Dunjiang Liu: Investigation; methodology. Cuilan Liu: Investigation; methodology. Changyun Qiu: Investigation; methodology. Chao Chen: Investigation; methodology. Zhicheng Xu: Investigation; methodology. Jinbo Chen: Investigation; methodology. Wei Li: Conceptualization; formal analysis; investigation; methodology; writing – original draft.
Disclosure and competing interests statement
The authors declare that they have no conflict of interest.
Supporting information
Expanded View Figures PDF
Review Process File
PDF+
Source Data for Expanded View
Source Data for Figure 1
Source Data for Figure 2
Source Data for Figure 3
Source Data for Figure 4
Source Data for Figure 5
Source Data for Figure 6
Source Data for Figure 7
Source Data for Figure 8
Source Data for Figure 9
Source Data for Figure 10
Source Data for Figure 11
Source Data for Figure 12
Source Data for Figure 13
Acknowledgements
This work was supported by the following grants: National Natural Science Foundation of China (81901380 to BL, 81500930 to HY and 81701192 to XF), Natural Science Foundation of Shandong Province (ZR2017BC047 to BL, ZR2020QH128 to JY, ZR2014HQ014 to HY and ZR2017BH078 to XF) and Scientific Research Foundation of Binzhou Medical University (BY2016KYQD21 to BL, BY2021LCX20 to LS and BY2021KJ01 to LS).
EMBO reports (2023) 24: e57176
Contributor Information
Wei Li, Email: yishengliwei@163.com.
Bin Liu, Email: liubin3714@126.com.
Data availability
The RNA‐seq data have been deposited to Gene Expression Omnibus (GEO) database with the accession code GSE216370 (http://www.ncbi.nlm.nih.gov/geo/query/acc.cgi?acc=GSE216370). All data generated in this study are included in this article. Source data are provided with this paper or upon request from the corresponding authors.
References
- Amadio P, Zarà M, Sandrini L, Ieraci A, Barbieri SS (2020) Depression and cardiovascular disease: the viewpoint of platelets. Int J Mol Sci 21: 7560 [DOI] [PMC free article] [PubMed] [Google Scholar]
- Aune UL, Ruiz L, Kajimura S (2013) Isolation and differentiation of stromal vascular cells to beige/brite cells. J Vis Exp 73: 50191 [DOI] [PMC free article] [PubMed] [Google Scholar]
- Branyan KW, Devallance ER, Lemaster KA, Skinner RC, Bryner RW, Olfert IM, Kelley EE, Frisbee JC, Chantler PD (2018) Role of chronic stress and exercise on microvascular function in metabolic syndrome. Med Sci Sports Exerc 50: 957–966 [DOI] [PMC free article] [PubMed] [Google Scholar]
- Cardoso F, Klein Wolterink RGJ, Godinho‐Silva C, Domingues RG, Ribeiro H, da Silva JA, Mahú I, Domingos AI, Veiga‐Fernandes H (2021) Neuro‐mesenchymal units control ILC2 and obesity via a brain‐adipose circuit. Nature 597: 410–414 [DOI] [PMC free article] [PubMed] [Google Scholar]
- Chaurasia B, Tippetts TS, Mayoral Monibas R, Liu J, Li Y, Wang L, Wilkerson JL, Sweeney CR, Pereira RF, Sumida DH et al (2021) Targeting a ceramide double bond improves insulin resistance and hepatic steatosis. Science 365: 386–392 [DOI] [PMC free article] [PubMed] [Google Scholar]
- Chen J, Zeng W, Pan W, Peng C, Zhang J, Su J, Long W, Zhao H, Zuo X, Xie X et al (2018) Symptoms of systemic lupus erythematosus are diagnosed in leptin transgenic pigs. PLoS Biol 16: e2005354 [DOI] [PMC free article] [PubMed] [Google Scholar]
- Chen TC, Benjamin DI, Kuo T, Lee RA, Li ML, Mar DJ, Costello DE, Nomura DK, Wang JC (2017) The glucocorticoid‐Angptl4‐ceramide axis induces insulin resistance through PP2A and PKCζ. Sci Signal 10: eaai7905 [DOI] [PMC free article] [PubMed] [Google Scholar]
- Chi J, Wu Z, Choi CHJ, Nguyen L, Tegegne S, Ackerman SE, Crane A, Marchildon F, Tessier‐Lavigne M, Cohen P (2018) Three‐dimensional adipose tissue imaging reveals regional variation in beige fat biogenesis and PRDM16‐dependent sympathetic neurite density. Cell Metab 27: 226–236 [DOI] [PubMed] [Google Scholar]
- Choi YH, Fujikawa T, Lee J, Reuter A, Kim KW (2013) Revisiting the ventral medial nucleus of the hypothalamus: the roles of SF‐1 neurons in energy homeostasis. Front Neurosci 7: 71 [DOI] [PMC free article] [PubMed] [Google Scholar]
- Chrousos GP (2009) Stress and disorders of the stress system. Nat Rev Endocrinol 5: 374–381 [DOI] [PubMed] [Google Scholar]
- Courtet P, Olié E (2012) Circadian dimension and severity of depression. Eur Neuropsychopharmacol 22: S476–S481 [DOI] [PubMed] [Google Scholar]
- Dai S, Mo Y, Wang Y, Xiang B, Liao Q, Zhou M, Li X, Li Y, Xiong W, Li G et al (2020) Chronic stress promotes cancer development. Front Oncol 10: 1492 [DOI] [PMC free article] [PubMed] [Google Scholar]
- Dang TQ, Yoon N, Chasiotis H, Dunford EC, Feng Q, He P, Riddell MC, Kelly SP, Sweeney G (2017) Transendothelial movement of adiponectin is restricted by glucocorticoids. J Endocrinol 234: 101–114 [DOI] [PMC free article] [PubMed] [Google Scholar]
- Daniela M, Catalina L, Ilie O, Paula M, Daniel‐Andrei I, Ioana B (2022) Effects of exercise training on the autonomic nervous system with a focus on anti‐inflammatory and antioxidants effects. Antioxidants 11: 350 [DOI] [PMC free article] [PubMed] [Google Scholar]
- DiMicco JA, Samuels BC, Zaretskaia MV, Zaretsky DV (2002) The dorsomedial hypothalamus and the response to stress: part renaissance, part revolution. Pharmacol Biochem Behav 71: 469–480 [DOI] [PubMed] [Google Scholar]
- Dimicco JA, Zaretsky DV (2007) The dorsomedial hypothalamus: a new player in thermoregulation. Am J Physiol Regul Integr Comp Physiol 292: R47–R63 [DOI] [PubMed] [Google Scholar]
- Duerrschmid C, He Y, Wang C, Li C, Bournat JC, Romere C, Saha PK, Lee ME, Phillips KJ, Jain M et al (2017) Asprosin is a centrally acting orexigenic hormone. Nat Med 23: 1444–1453 [DOI] [PMC free article] [PubMed] [Google Scholar]
- Eikelis N, Esler M, Barton D, Dawood T, Wiesner G, Lambert G (2006) Reduced brain leptin in patients with major depressive disorder and in suicide victims. Mol Psychiatry 11: 800–801 [DOI] [PubMed] [Google Scholar]
- Fang H, Judd RL (2018) Adiponectin regulation and function. Compr Physiol 8: 1031–1063 [DOI] [PubMed] [Google Scholar]
- Fasshauer M, Blüher M (2015) Adipokines in health and disease. Trends Pharmacol Sci 36: 461–470 [DOI] [PubMed] [Google Scholar]
- Fontes MA, Xavier CH, Marins FR, Limborço‐Filho M, Vaz GC, Müller‐Ribeiro FC, Nalivaiko E (2014) Emotional stress and sympathetic activity: contribution of dorsomedial hypothalamus to cardiac arrhythmias. Brain Res 1554: 49–58 [DOI] [PubMed] [Google Scholar]
- Fretz JA, Nelson T, Xi Y, Adams DJ, Rosen CJ, Horowitz MC (2010) Altered metabolism and lipodystrophy in the early B‐cell factor 1‐deficient mouse. Endocrinology 151: 1611–1621 [DOI] [PMC free article] [PubMed] [Google Scholar]
- Gangwisch JE (2009) Epidemiological evidence for the links between sleep, circadian rhythms and metabolism. Obes Rev 10: 37–45 [DOI] [PMC free article] [PubMed] [Google Scholar]
- Ge T, Fan J, Yang W, Cui R, Li B (2018) Leptin in depression: a potential therapeutic target. Cell Death Dis 9: 1096 [DOI] [PMC free article] [PubMed] [Google Scholar]
- Gonzalez‐Gil AM, Elizondo‐Montemayor L (2020) The role of exercise in the interplay between myokines, hepatokines, osteokines, adipokines, and modulation of inflammation for energy substrate redistribution and fat mass loss: a review. Nutrients 12: 1899 [DOI] [PMC free article] [PubMed] [Google Scholar]
- Hara K, Boutin P, Mori Y, Tobe K, Dina C, Yasuda K, Yamauchi T, Otabe S, Okada T, Eto K et al (2002) Genetic variation in the gene encoding adiponectin is associated with an increased risk of type 2 diabetes in the Japanese population. Diabetes 51: 536–540 [DOI] [PubMed] [Google Scholar]
- Herman JP, McKlveen JM, Ghosal S, Kopp B, Wulsin A, Makinson R, Scheimann J, Myers B (2016) Regulation of the hypothalamic‐pituitary‐adrenocortical stress response. Compr Physiol 6: 603–621 [DOI] [PMC free article] [PubMed] [Google Scholar]
- Holt RI, de Groot M, Lucki I, Hunter CM, Sartorius N, Golden SH (2014) NIDDK international conference report on diabetes and depression: current understanding and future directions. Diabetes Care 37: 2067–2077 [DOI] [PMC free article] [PubMed] [Google Scholar]
- Hu W, Li L, Yang M, Luo X, Ran W, Liu D, Xiong Z, Liu H, Yang G (2013) Circulating Sfrp5 is a signature of obesity‐related metabolic disorders and is regulated by glucose and liraglutide in humans. J Clin Endocrinol Metab 98: 290–298 [DOI] [PubMed] [Google Scholar]
- Jiang Z, Rajamanickam S, Justice NJ (2019) CRF signaling between neurons in the paraventricular nucleus of the hypothalamus (PVN) coordinates stress responses. Neurobiol Stress 11: 100192 [DOI] [PMC free article] [PubMed] [Google Scholar]
- Joseph JJ, Golden SH (2017) Cortisol dysregulation: the bidirectional link between stress, depression, and type 2 diabetes mellitus. Ann N Y Acad Sci 1391: 20–34 [DOI] [PMC free article] [PubMed] [Google Scholar]
- Kaikaew K, Steenbergen J, van Dijk TH, Grefhorst A, Visser JA (2019) Sex difference in corticosterone‐induced insulin resistance in mice. Endocrinology 160: 2367–2387 [DOI] [PMC free article] [PubMed] [Google Scholar]
- Kostov K, Halacheva L (2018) Role of magnesium deficiency in promoting atherosclerosis, endothelial dysfunction, and arterial stiffening as risk factors for hypertension. Int J Mol Sci 19: 1724 [DOI] [PMC free article] [PubMed] [Google Scholar]
- Lee TH, Cheng KK, Hoo RL, Siu PM, Yau SY (2019) The novel perspectives of adipokines on brain health. Int J Mol Sci 20: 5638 [DOI] [PMC free article] [PubMed] [Google Scholar]
- Lightman SL, Birnie MT, Conway‐Campbell BL (2020) Dynamics of ACTH and cortisol secretion and implications for disease. Endocr Rev 41: bnaa002 [DOI] [PMC free article] [PubMed] [Google Scholar]
- Lin Z, Tian H, Lam KS, Lin S, Hoo RC, Konishi M, Itoh N, Wang Y, Bornstein SR, Xu A et al (2013) Adiponectin mediates the metabolic effects of FGF21 on glucose homeostasis and insulin sensitivity in mice. Cell Metab 17: 779–789 [DOI] [PubMed] [Google Scholar]
- Liu J, Guo M, Zhang D, Cheng SY, Liu M, Ding J, Scherer PE, Liu F, Lu XY (2012) Adiponectin is critical in determining susceptibility to depressive behaviors and has antidepressant‐like activity. Proc Natl Acad Sci U S A 109: 12248–12253 [DOI] [PMC free article] [PubMed] [Google Scholar]
- Livak KJ, Schmittgen TD (2001) Analysis of relative gene expression data using real‐time quantitative PCR and the 2(‐Delta Delta C(T)) method. Methods 25: 402–408 [DOI] [PubMed] [Google Scholar]
- Mahar I, Bambico FR, Mechawar N, Nobrega JN (2014) Stress, serotonin, and hippocampal neurogenesis in relation to depression and antidepressant effects. Neurosci Biobehav Rev 38: 173–192 [DOI] [PubMed] [Google Scholar]
- Malkesman O, Scattoni ML, Paredes D, Tragon T, Pearson B, Shaltiel G, Chen G, Crawley JN, Manji HK (2010) The female urine sniffing test: a novel approach for assessing reward‐seeking behavior in rodents. Biol Psychiatry 67: 864–871 [DOI] [PMC free article] [PubMed] [Google Scholar]
- Moon HS, Dalamaga M, Kim SY, Polyzos SA, Hamnvik OP, Magkos F, Paruthi J, Mantzoros CS (2013) Leptin's role in lipodystrophic and nonlipodystrophic insulin‐resistant and diabetic individuals. Endocr Rev 34: 377–412 [DOI] [PMC free article] [PubMed] [Google Scholar]
- Moulton CD, Pickup JC, Ismail K (2015) The link between depression and diabetes: the search for shared mechanisms. Lancet Diabetes Endocrinol 3: 461–471 [DOI] [PubMed] [Google Scholar]
- Ouchi N, Higuchi A, Ohashi K, Oshima Y, Gokce N, Shibata R, Akasaki Y, Shimono A, Walsh K (2010) Sfrp5 is an anti‐inflammatory adipokine that modulates metabolic dysfunction in obesity. Science 329: 454–457 [DOI] [PMC free article] [PubMed] [Google Scholar]
- Pedersen BK (2019) Physical activity and muscle‐brain crosstalk. Nat Rev Endocrinol 15: 383–392 [DOI] [PubMed] [Google Scholar]
- Petersen MC, Shulman GI (2018) Mechanisms of insulin action and insulin resistance. Physiol Rev 98: 2133–2223 [DOI] [PMC free article] [PubMed] [Google Scholar]
- Poret JM, Molina PE, Simon L (2021) Isolation, proliferation and differentiation of rhesus macaque adipose‐derived stem cells. J Vis Exp 171: 61732 [DOI] [PMC free article] [PubMed] [Google Scholar]
- Prabhakar NR, Peng YJ, Nanduri J (2020) Hypoxia‐inducible factors and obstructive sleep apnea. J Clin Invest 130: 5042–5051 [DOI] [PMC free article] [PubMed] [Google Scholar]
- Price RB, Duman R (2020) Neuroplasticity in cognitive and psychological mechanisms of depression: an integrative model. Mol Psychiatry 25: 530–543 [DOI] [PMC free article] [PubMed] [Google Scholar]
- Romere C, Duerrschmid C, Bournat J, Constable P, Jain M, Xia F, Saha PK, Del Solar M, Zhu B, York B et al (2016) Asprosin, a fasting‐induced glucogenic protein hormone. Cell 165: 566–579 [DOI] [PMC free article] [PubMed] [Google Scholar]
- Ryu V, Buettner C (2019) Fat cells gobbling up norepinephrine? PLoS Biol 17: e3000138 [DOI] [PMC free article] [PubMed] [Google Scholar]
- Schweizer S, Liebisch G, Oeckl J, Hoering M, Seeliger C, Schiebel C, Klingenspor M, Ecker J (2019) The lipidome of primary murine white, brite, and brown adipocytes‐Impact of beta‐adrenergic stimulation. PLoS Biol 17: e3000412 [DOI] [PMC free article] [PubMed] [Google Scholar]
- Sepandar F, Daneshpazhooh M, Djalali M, Mohammadi H, Yaghubi E, Fakhri Z, Tavakoli H, Ghaedi E, Keshavarz A, Zarei M et al (2020) The effect of l‐carnitine supplementation on serum levels of omentin‐1, visfatin and SFRP5 and glycemic indices in patients with pemphigus vulgaris: a randomized, double‐blind, placebo‐controlled clinical trial. Phytother Res 34: 859–866 [DOI] [PubMed] [Google Scholar]
- Shaulian E, Karin M (2002) AP‐1 as a regulator of cell life and death. Nat Cell Biol 4: E131–E136 [DOI] [PubMed] [Google Scholar]
- Stetler C, Miller GE (2011) Depression and hypothalamic‐pituitary‐adrenal activation: a quantitative summary of four decades of research. Psychosom Med 73: 114–126 [DOI] [PubMed] [Google Scholar]
- Stuart MJ, Baune BT (2012) Depression and type 2 diabetes: inflammatory mechanisms of a psychoneuroendocrine co‐morbidity. Neurosci Biobehav Rev 36: 658–676 [DOI] [PubMed] [Google Scholar]
- Wagner EF, Eferl R (2005) Fos/AP‐1 proteins in bone and the immune system. Immunol Rev 208: 126–140 [DOI] [PubMed] [Google Scholar]
- Wang P, Loh KH, Wu M, Morgan DA, Schneeberger M, Yu X, Chi J, Kosse C, Kim D, Rahmouni K et al (2020) A leptin‐BDNF pathway regulating sympathetic innervation of adipose tissue. Nature 583: 839–844 [DOI] [PubMed] [Google Scholar]
- Wang YN, Tang Y, He Z, Ma H, Wang L, Liu Y, Yang Q, Pan D, Zhu C, Qian S et al (2021) Slit3 secreted from M2‐like macrophages increases sympathetic activity and thermogenesis in adipose tissue. Nat Metab 3: 1536–1551 [DOI] [PubMed] [Google Scholar]
- Westfall S, Caracci F, Estill M, Frolinger T, Shen L, Pasinetti GM (2021) Chronic stress‐induced depression and anxiety priming modulated by gut‐brain‐axis immunity. Front Immunol 12: 670500 [DOI] [PMC free article] [PubMed] [Google Scholar]
- Wu YT, Huang WY, Kor CT, Liu KH, Chen TY, Lin PT, Wu HM (2021) Relationships between depression and anxiety symptoms and adipocyte‐derived proteins in postmenopausal women. PLoS One 16: e0248314 [DOI] [PMC free article] [PubMed] [Google Scholar]
- Xu A, Lam MC, Chan KW, Wang Y, Zhang J, Hoo RL, Xu JY, Chen B, Chow WS, Tso AW et al (2005) Angiopoietin‐like protein 4 decreases blood glucose and improves glucose tolerance but induces hyperlipidemia and hepatic steatosis in mice. Proc Natl Acad Sci U S A 102: 6086–6091 [DOI] [PMC free article] [PubMed] [Google Scholar]
- Yang F, Liu Y, Chen S, Dai Z, Yang D, Gao D, Shao J, Wang Y, Wang T, Zhang Z et al (2020) A GABAergic neural circuit in the ventromedial hypothalamus mediates chronic stress‐induced bone loss. J Clin Invest 130: 6539–6554 [DOI] [PMC free article] [PubMed] [Google Scholar]
- You J, Sun L, Wang J, Sun F, Wang W, Wang D, Fan X, Liu D, Xu Z, Qiu C et al (2021) Role of Adiponectin‐Notch pathway in cognitive dysfunction associated with depression and in the therapeutic effect of physical exercise. Aging Cell 20: e13387 [DOI] [PMC free article] [PubMed] [Google Scholar]
- Yuan M, Li W, Zhu Y, Yu B, Wu J (2020) Asprosin: a novel player in metabolic diseases. Front Endocrinol 11: 64 [DOI] [PMC free article] [PubMed] [Google Scholar]
- Zeng W, Pirzgalska RM, Pereira MM, Kubasova N, Barateiro A, Seixas E, Lu YH, Kozlova A, Voss H, Martins GG et al (2015) Sympathetic neuro‐adipose connections mediate leptin‐driven lipolysis. Cell 163: 84–94 [DOI] [PubMed] [Google Scholar]
- Zhang Y, Chua S Jr (2017) Leptin function and regulation. Compr Physiol 8: 351–369 [DOI] [PubMed] [Google Scholar]
Associated Data
This section collects any data citations, data availability statements, or supplementary materials included in this article.
Supplementary Materials
Expanded View Figures PDF
Review Process File
PDF+
Source Data for Expanded View
Source Data for Figure 1
Source Data for Figure 2
Source Data for Figure 3
Source Data for Figure 4
Source Data for Figure 5
Source Data for Figure 6
Source Data for Figure 7
Source Data for Figure 8
Source Data for Figure 9
Source Data for Figure 10
Source Data for Figure 11
Source Data for Figure 12
Source Data for Figure 13
Data Availability Statement
The RNA‐seq data have been deposited to Gene Expression Omnibus (GEO) database with the accession code GSE216370 (http://www.ncbi.nlm.nih.gov/geo/query/acc.cgi?acc=GSE216370). All data generated in this study are included in this article. Source data are provided with this paper or upon request from the corresponding authors.


