
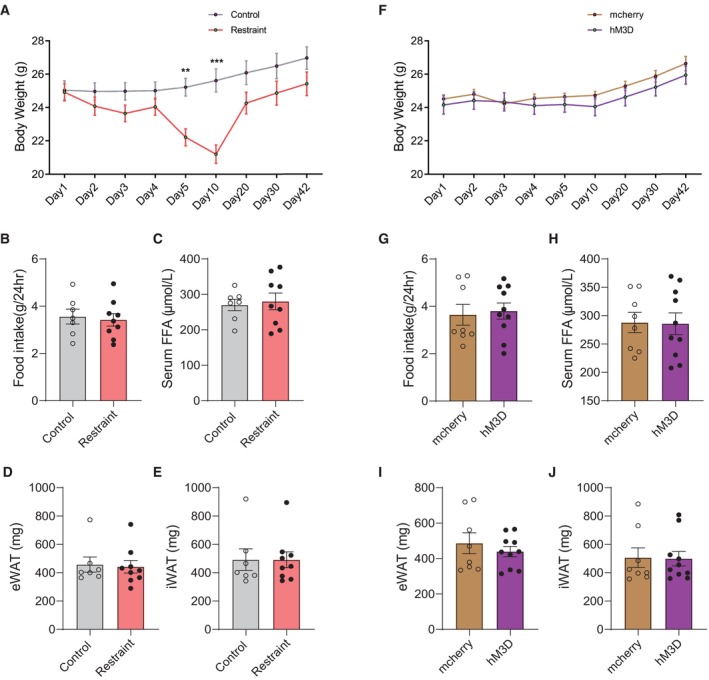
Figure EV2. Body weight, fat weight, food intake and serum FFA level under chronic restraint stress and PVN activation paradigms.
-
AThe body weight of mice during chronic restraint paradigms. subgroups, F (1, 14) = 4.414, P = 0.0542; time, F (8, 112) = 52.15, P < 0.0001; subgroups × time, F (8, 112) = 26.58, P < 0.0001.
-
BThe amount of accumulative of 24‐h food intake after chronic restraint treatment. two‐tailed unpaired t‐test, t (14) = 0.3420, P = 0.7374.
-
CThe serum FFA level after chronic restraint treatment. two‐tailed unpaired t‐test, t (14) = 0.3358, P = 0.7420.
-
D–FThe mass of eWAT (D, Mann–Whitney U‐test, P = 0.9182) and iWAT (E, Mann–Whitney U‐test, P > 0.9999) after chronic restraint treatment. F. the body weight of mice during chronic PVN activation. subgroups, F (1, 16) = 0.5661, P = 0.4627; time, F (8, 128) = 51.72, P < 0.0001; subgroups × time, F (8, 128) = 1.772, P = 0.0883.
-
GThe amount of accumulative of 24‐h food intake after chronically reactivating PVN neurons. Mann–Whitney U‐test, P = 0.7618.
-
HThe serum FFA level after chronically reactivating PVN neurons. two‐tailed unpaired t‐test, t (16) = 0.08091, P = 0.9365.
-
I, JThe mass of eWAT (I, two‐tailed unpaired t‐test, t (16) = 0.7674, P = 0.4540) and iWAT (J, Mann–Whitney U‐test, P = 0.8968) after chronic restraint treatment.
Data information: Control group n = 7, restraint group n = 9 in (A–E); mcherry group n = 8, hM3D group n = 10 in (F–J). Shapiro–Wilk test and F‐test were used to test the normality and equal variance assumptions, respectively. Two‐tailed t‐tests were performed to assess differences between two experimental groups with normally distributed data and equal variance. Two‐tailed t‐tests with Welch's correction were used when a two‐sample comparison of means with unequal variances. For non‐normally distributed data, Mann–Whitney U‐tests were performed to compare two groups. For multiple groups, two‐way ANOVAs followed by Sidak multiple comparisons test were used. P < 0.05 was considered statistically significant. **P < 0.01, ***P < 0.001. Data are presented as means ± SEM.
Source data are available online for this figure.