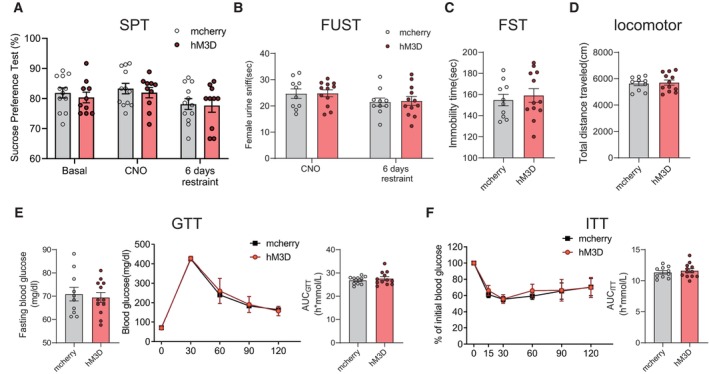
Figure EV4. Chronic activation of the PV neurons responding to restraint stress did not affect depressive‐like behaviours or insulin resistance.

-
A–DChronically reactivating hM3D‐labelled PV neurons did not affect the depressive‐like behaviours, as evaluated by SPT (A, subgroups, F (1, 20) = 0.8020, P = 0.3812; treatment, F (2, 40) = 2.940, P = 0.0644; subgroups × treatment, F (2, 40) = 0.03915, P = 0.9616), FUST (B, subgroups, F (1, 20) = 0.04271, P = 0.8384; treatment, F (1, 20) = 2.907, P = 0.1037; subgroups × treatment, F (1, 20) = 0.007554, P = 0.9316) and FST (C, two‐tailed unpaired t‐test, t (20) = 0.4940, P = 0.6267) and the locomotor activity (D, two‐tailed unpaired t‐test, t (20) = 0.2734, P = 0.7874).
-
E, FChronically reactivating hM3D‐labelled PV neurons did not induce insulin resistance evaluated by GTT (E, left, fasting blood glucose level, two‐tailed unpaired t‐test, t (20) = 0.4146, P = 0.6829; middle, glucose tolerance test, subgroups, F (1, 20) = 0.2836, P = 0.6002; time, F (4, 80) = 497.7, P < 0.0001; subgroups × treatment, F (4, 80) = 0.7470, P = 0.5629; right, the area under the curve of GTT, two‐tailed unpaired t‐test, t (20) = 0.7050, P = 0.4889) and ITT (F, left, subgroups, F (1, 20) = 0.8558, P = 0.3659; time, F (5, 100) = 131.8, P < 0.0001; subgroups × treatment, F (5, 100) = 1.249, P = 0.2923; right, the area under the curve of ITT, two‐tailed unpaired t‐test with Welch's correction, t (20) = 0.5915, P = 0.5608).
Data information: mcherry group n = 10, hM3D group n = 12 in (A–F). Shapiro–Wilk test and F‐test were used to test the normality and equal variance assumptions, respectively. Two‐tailed t‐tests were performed to assess differences between two experimental groups with normally distributed data and equal variance. Two‐tailed t‐tests with Welch's correction were used when a two‐sample comparison of means with unequal variances. For non‐normally distributed data, Mann–Whitney U‐tests were performed to compare two groups. For multiple groups, two‐way ANOVAs followed by Sidak multiple comparisons test were used. P < 0.05 was considered statistically significant. Data are presented as means ± SEM.
Source data are available online for this figure.
