
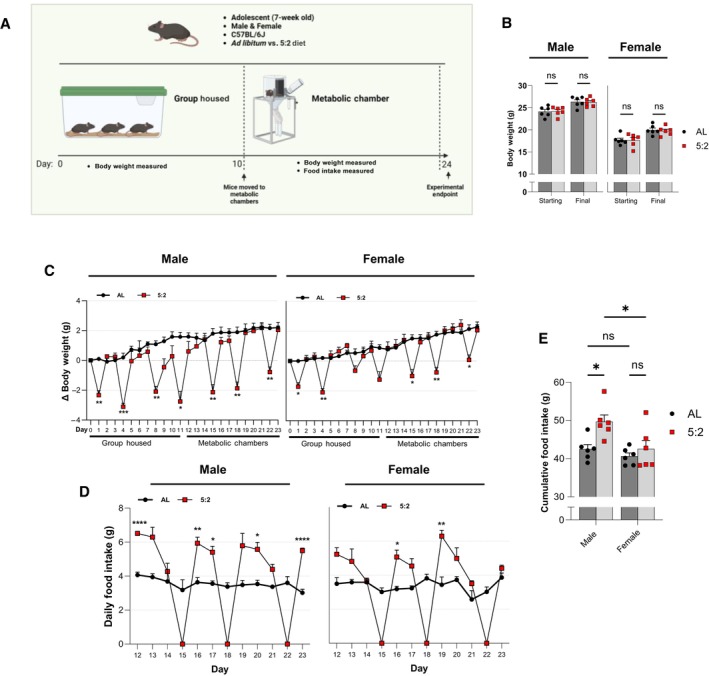
Figure EV1. Association between body weight change and food intake during 5:2 dietary regimen (related to Fig 1).
-
ASchematic overview of the experimental design. 7‐week‐old male and female C57BL/6J mice were fed either ad libitum or on the 5:2 diet for 24 days. Mice were group housed for the first 10 days of the intervention before being moved to individual metabolic chambers to measure daily food intake in addition to body weight.
-
BStarting (day 0) and final (day 23) body weights in male (left) and female (right) mice.
-
CDaily body weight changes (Δ Body Weight) over the experimental time course.
-
DDaily food intake between days 12 and 23.
-
ECumulative food intake at the end of the recording period.
Data Information: For (B) and (E), symbols represent individual mice, bars represent mean values, error bars represent SEM. For (C) and (D), symbols represent mean values, error bars represent SEM. Statistical comparisons made using RM 2‐way ANOVA for (B–D) and ordinary 2‐way ANOVA for (E). Šídák's multiple comparisons used for post hoc assessments. ns P ≥ 0.05; *P ≤ 0.05; **P ≤ 0.01; ***P ≤ 0.001; ****P ≤ 0.0001. n = 6 mice per group.
Source data are available online for this figure.