
Figure EV2. Further characterisation of BrdU+/NeuN+ cell counts (Related to Fig 4).
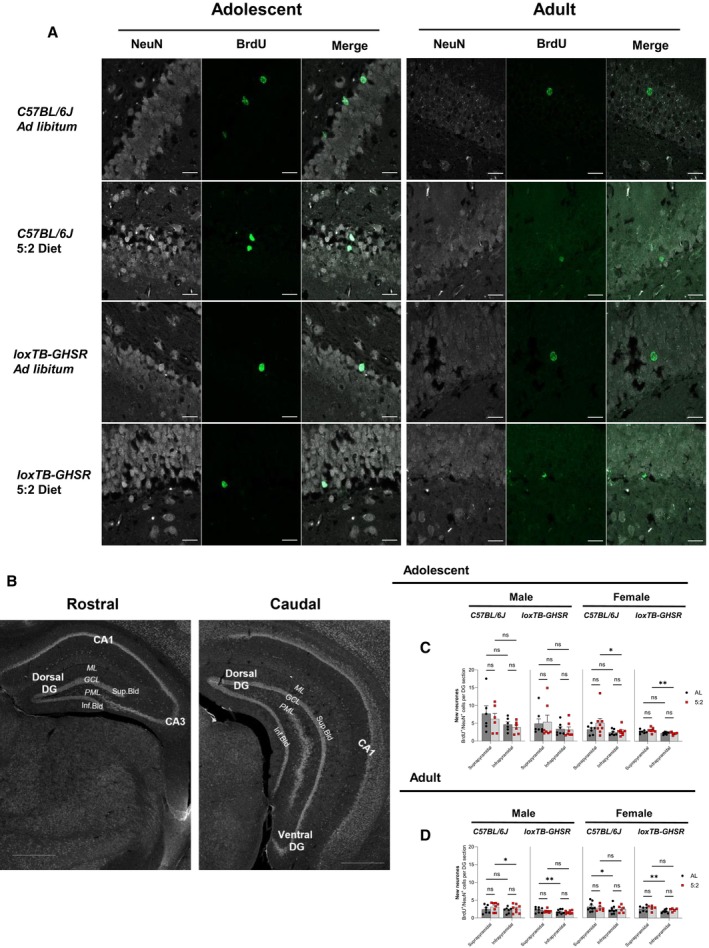
- Representative multichannel images of BrdU (488 nm) and NeuN (568 nm) immunofluorescence in the DG of adolescent and adult male C57BL/6J mice. Images were acquired with an LSM980‐Airyscan2 confocal system (Zeiss), using the SR‐4Y airyscan mode. Scale bars represent 20 μm. It should be noted that the top row images (ad libitum fed animals) depict the same cells shown in the maximum intensity projections of Fig 4A.
- Annotated microscopy images of selected rostral and caudal hippocampal sections from Fig 4D. Images have been re‐used to clarify the anatomical labelling used for the rostral and caudal dentate gyrus (DG) in this study. The three layers of the DG, the molecular layer (ML), granule cell layer (GCL) and polymorphic layer (PML), as well as the suprapyramidal (Sup.bld) and infrapyramidal (Inf.bld) blades of the GCL are highlighted in both images. The DG is entirely dorsal in the rostral image, whereas both dorsal and ventral portions of the DG are evident in the caudal image. In addition to the DG, both CA1 and CA3 hippocampal subfields are present in the rostral image, but only the CA1 is present in the representative caudal image. Scale bars represent 500 μm.
- Quantification of BrdU+/NeuN+ cells in the suprapyramidal and infrapyramidal blades of the DG in adolescent mice.
- Quantification of BrdU+/NeuN+ cells in the suprapyramidal and infrapyramidal blades of the DG in adult mice.
Data Information: Symbols represent individual mice, bars represent mean values, error bars represent SEM. Statistical comparisons made using RM 2‐way ANOVA with Šídák's multiple comparisons post hoc assessments. ns P ≥ 0.05; *P ≤ 0.05; **P ≤ 0.01. n = 5–9 mice per group.
Source data are available online for this figure.