
Figure 3. Effect of 5:2 diet on immature neurone abundance and maturation.
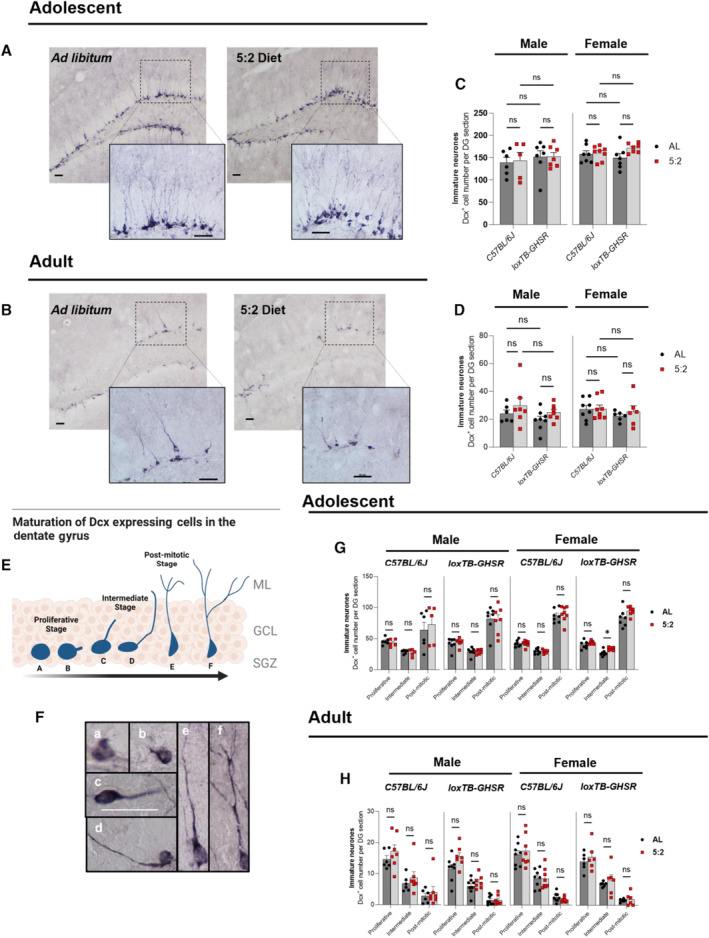
- Representative light microscopy images of DCX+ immunoreactivity, indicative of immature neurones, in the dentate gyrus (DG) of adolescent male mice. Scale bars represent 50 μm.
- Representative images of DCX+ immunoreactivity in adult male mice. Scale bars represent 50 μm.
- Average number of DCX+ cells per DG section in adolescent mice. DCX cell counts for each DG section were quantified using image J. The effect of diet (ad libitum vs. 5:2 diet) was assessed in the presence and absence of functional ghrelin receptor (GHSR) expression (C57BL/6J vs. loxTB‐GHSR) for both males and females.
- Average number of DCX+ cells per DG section in adult mice (same methodology as C).
- Schematic illustration of the maturation process that DCX expressing cells undergo in the neurogenic niche of the DG. Morphological categorisations based on the criteria established by Plümpe et al (2006).
- Representative microscopy images of DCX expressing cell morphologies a to f. Scale bar (shown in image of morphology c cell) represents 50 μm.
- Average number of proliferative, intermediate and post‐mitotic DCX expressing cells in adolescent mice. The effect of diet (ad libitum vs. 5:2 diet) was assessed independently for both sexes and both genotypes.
- Average number of proliferative, intermediate and post‐mitotic DCX expressing cells in adult mice (same methodology as G).
Data Information: Symbols represent individual mice, bars represent mean values, error bars represent SEM. Statistical comparisons made using ordinary 2‐way ANOVA for (C) and (D) and RM 2‐way ANOVA for (G) and (H). Šídák's multiple comparisons used for post hoc assessments. *P ≤ 0.05; ns P ≥ 0.05. n = 5–8 mice per group.
Source data are available online for this figure.