
Figure 4. 5:2 diet does not affect the generation of new cells or new neurones in the DG.
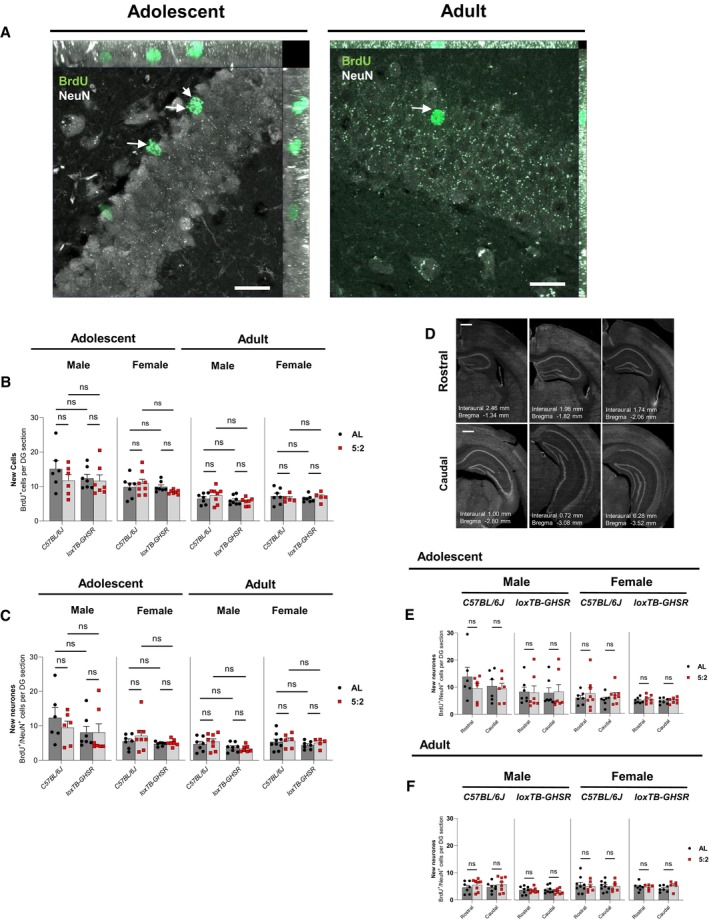
- Representative maximum intensity projections (MIPs) of BrdU (488 nm) and NeuN (568 nm) immunofluorescence in the DG of adolescent and adult male C57BL/6J ad libitum fed mice. Images were acquired with an LSM980‐Airyscan2 confocal system (Zeiss), using the SR‐4Y airyscan mode. Scale bars represent 20 μm. Arrows in the adolescent rep image indicate BrdU+/NeuN+ cells, while the arrow in the adult rep image shows a BrdU+/NeuN− cell.
- Quantification of total BrdU+ cells per DG section in adolescent and adult mice. Cells were manually counted. The effect of diet (ad libitum vs. 5:2 diet) was assessed in the presence and absence of functional ghrelin receptor (GHSR) expression (C57BL/6J vs. loxTB‐GHSR) for both males and females of both age groups.
- Quantification of BrdU+/NeuN+ cells, indicative of new neurones, per DG section in adolescent and adult mice (methodology same as B).
- Representative NeuN immunoreactivity across the hippocampal rostral‐caudal axis. Scale bars represent 500 μm.
- Quantification of BrdU+/NeuN+ cells in the rostral and caudal DG of adolescent mice. The effect of diet (ad libitum vs. 5:2 diet) was assessed independently for both sexes and both genotypes.
- Quantification of BrdU+/NeuN+ cells in the rostral and caudal DG of adult mice (same methodology as E).
Data Information: Symbols represent individual mice, bars represent mean values, error bars represent SEM. Statistical comparisons made using ordinary 2‐way ANOVA for (B) and (C) and RM 2‐way ANOVA for (E) and (F). Šídák's multiple comparisons used for post hoc assessments. ns P ≥ 0.05. n = 5–9 mice per group.
Source data are available online for this figure.