. 2023 Dec 7;131(12):127008. doi: 10.1289/EHP12854

Figure 2.

Figure 2A has five ribbon plus line graphs titled All-cause, Male, Female, less than 65 years, and greater than or equal to 65 years, plotting relative risk, ranging from 1.0 to 3.0 in increments of 0.5 (y-axis) across temperature (degree Celsius), ranging from negative 5 to 5 in increments of 5, 5 to 11 in increments of 6, 11 to 21 in increments of 5, 21 to 27 in increments of 6, and 27 to 32 in increments of 5 (x-axis) for mortality and emergency ambulance dispatches, respectively. Figure 2B has five ribbon plus line graphs titled Circulatory, Male, Female, less than 65 years, and greater than or equal to 65 years, plotting relative risk, ranging from 1.0 to 3.0 in increments of 0.5 (y-axis) across temperature (degree Celsius), ranging from negative 5 to 5 in increments of 5, 5 to 11 in increments of 6, 11 to 21 in increments of 5, 21 to 27 in increments of 6, and 27 to 32 in increments of 5 (x-axis) for mortality and emergency ambulance dispatches, respectively. Figure 2C has five ribbon plus line graphs titled Respiratory, Male, Female, less than 65 years, and greater than or equal to 65 years, plotting relative risk, ranging from 1.0 to 3.0 in increments of 0.5 (y-axis) across temperature (degree Celsius), ranging from negative 5 to 5 in increments of 5, 5 to 11 in increments of 6, 11 to 21 in increments of 5, 21 to 27 in increments of 6, and 27 to 32 in increments of 5 (x-axis) for mortality and emergency ambulance dispatches, respectively.

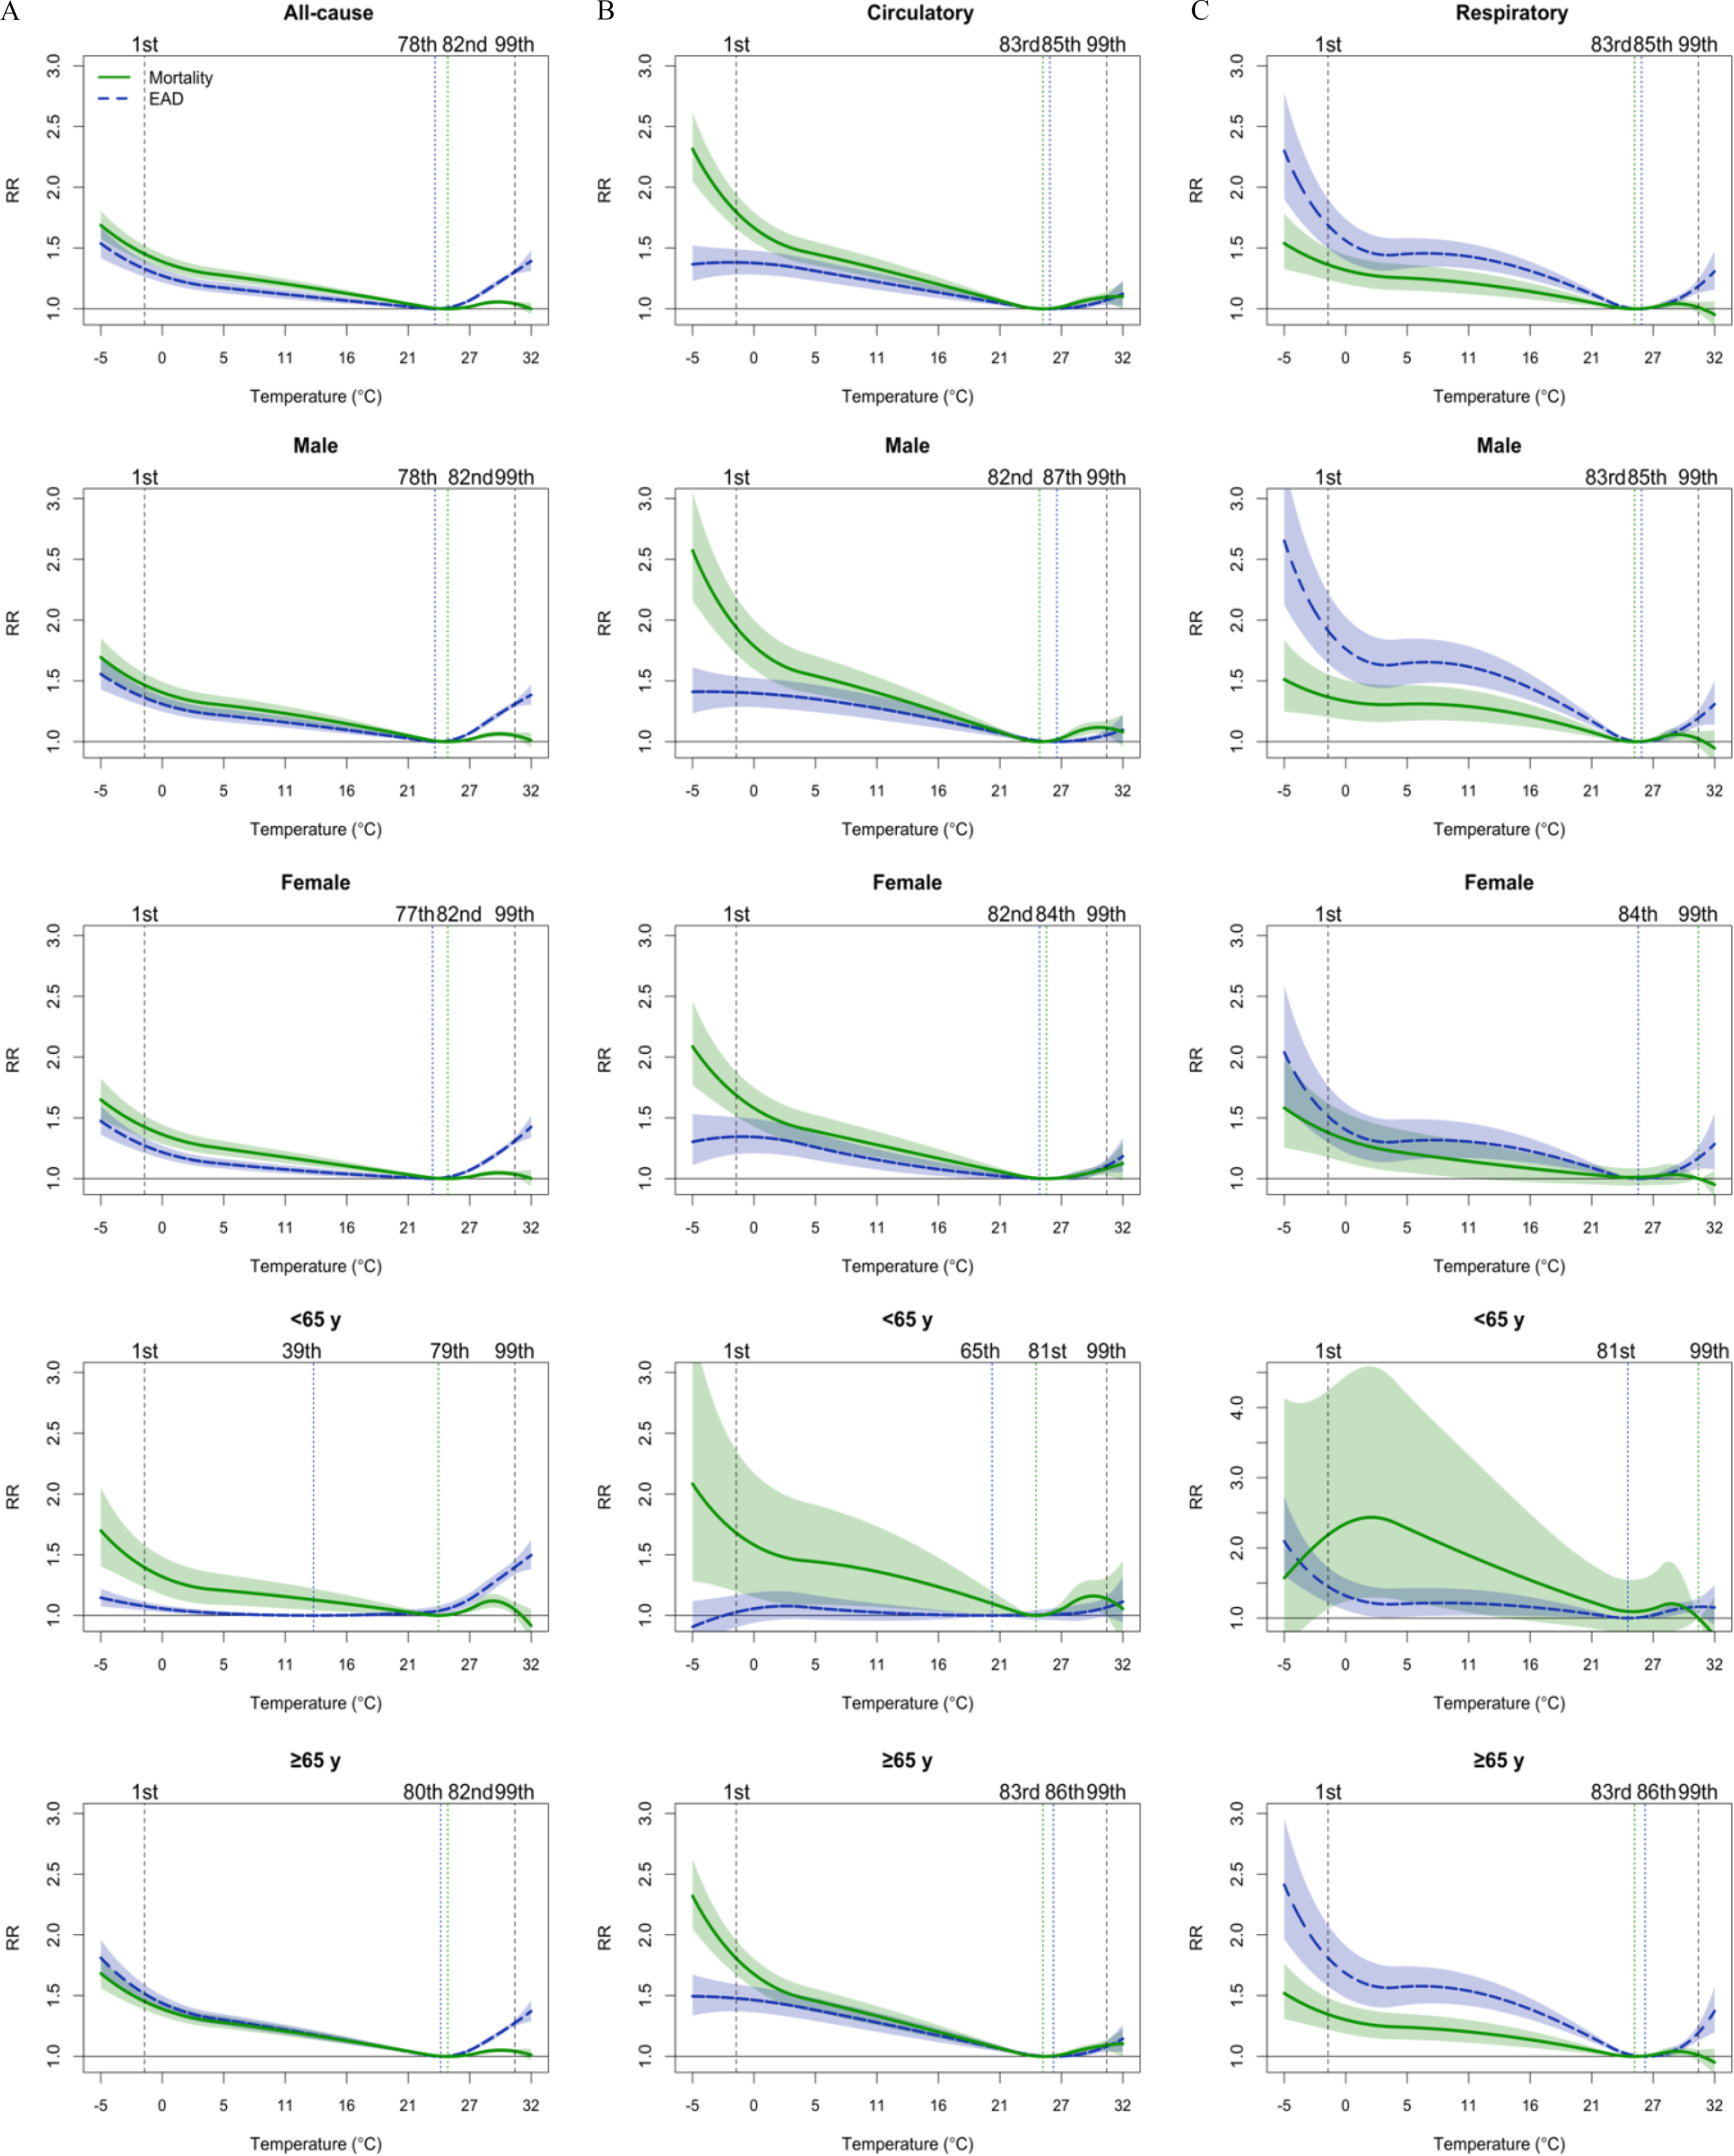
Cold and heat effects on all-cause and cause-specific mortality and EAD for the general population and different sex and age subgroups between 2015 and 2019 in Japan. The vertical lines represent the percentile of minimum mortality/morbidity temperature (dotted) and the 1st and 99th percentiles of the temperature distribution (dashed). See Table 2 for the corresponding numeric data for overall population and Table S7 for subgroup estimates. Note: EAD, emergency ambulance dispatches; RR, relative risk.