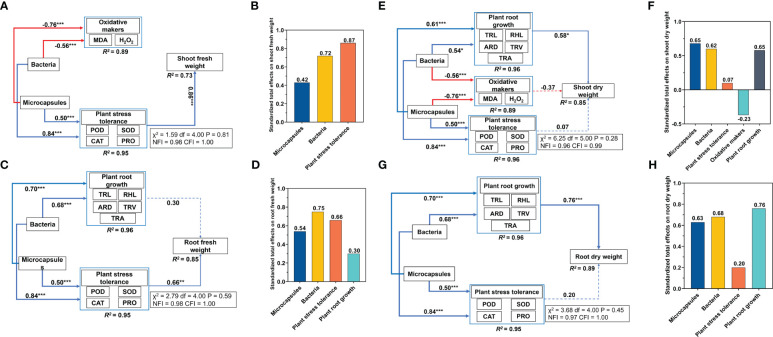
Figure 4.
Results of the structural equation modeling. (A, C, E, G) standardized total effects of bacteria and (B, D, F, H) microcapsules on shoot/root fresh and dry weights. See Figure 3 for abbreviations. Red lines, negative correlations; blue lines, positive correlations. Standardized path coefficients are described by the numbers on the lines. The proportions of variance explained for each dependent variable in the model are shown at the bottom and details evaluating the models are shown in the boxes beside each figure. * p < 0.05, **p < 0.01, *** p < 0.001.

