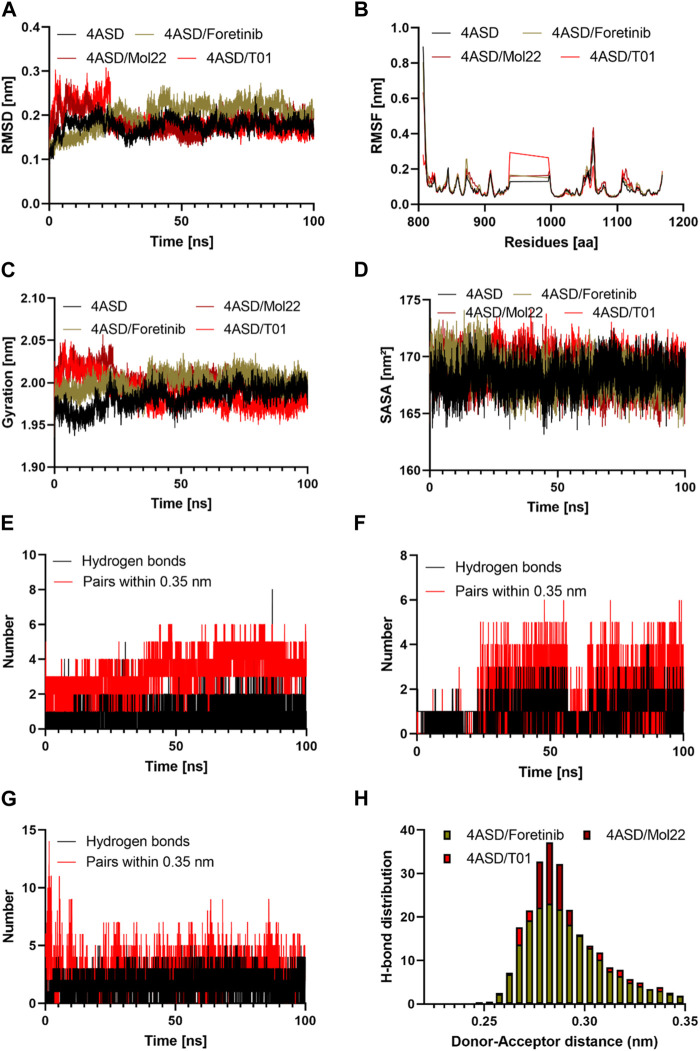
FIGURE 8.
The results of the molecular dynamics study: (A) Time evolution of the backbone of the target protein; (B) The comparative RMSF values for the target protein with the reference molecule, molecule 22, and designed molecule T01; (C) The comparative Radius of gyration values for the target protein with the reference molecule, molecule 22, and designed molecule T01; (E, F, G) The comparative hydrogen bonds and pairs within 0.35 nm for the target protein with the reference molecule, designed molecule 20, and designed molecule T01; (H) Hydrogen bond distributions of the reference molecule, molecule 22, and the designed molecule T01 with the target protein during the 100 ns. (D): The comparative SASA values for the target protein with reference molecule 22, and designed molecule T01.

