
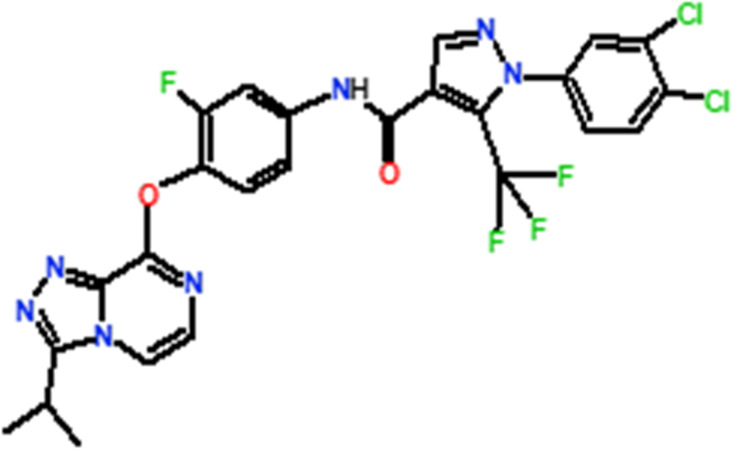
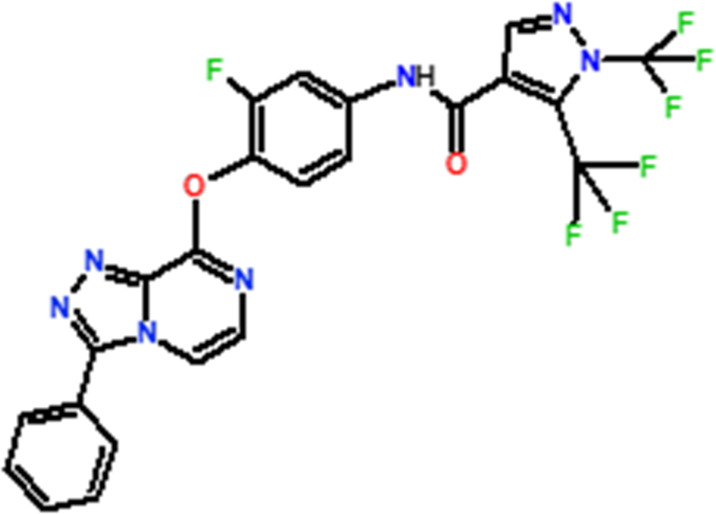
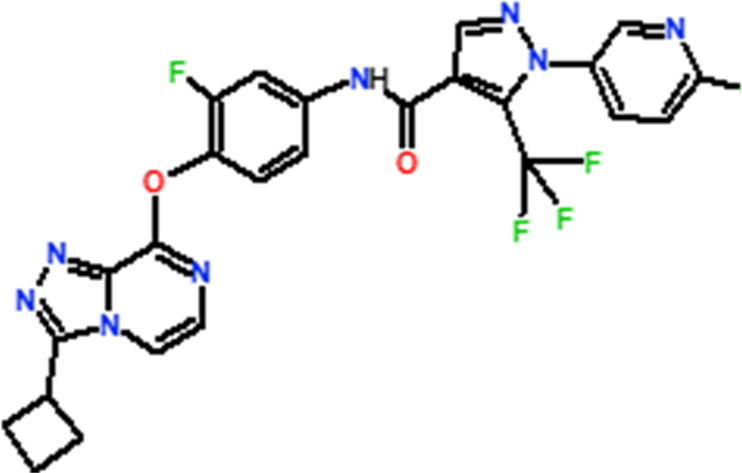
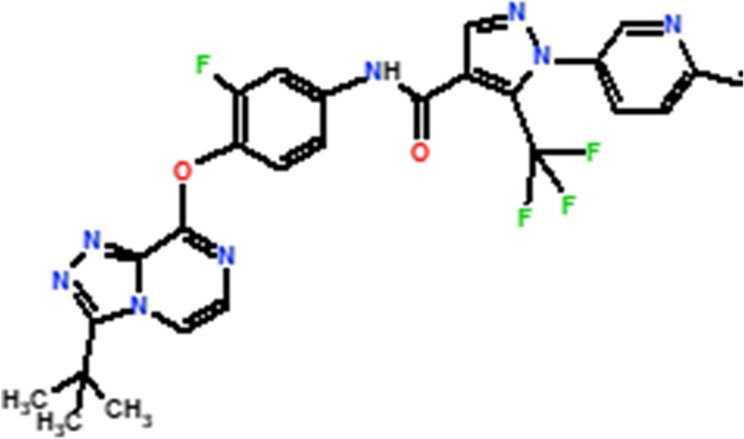
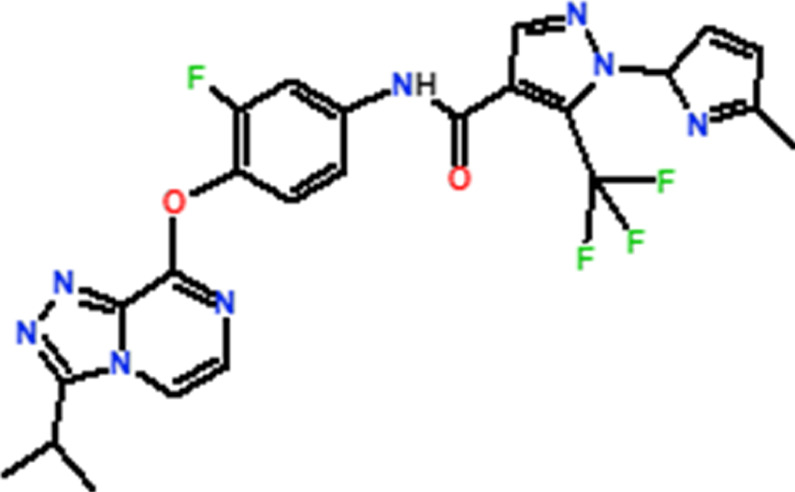
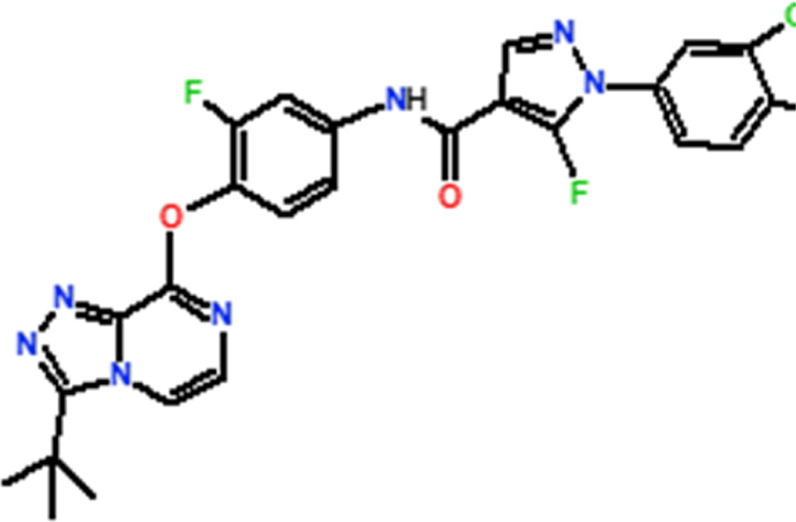
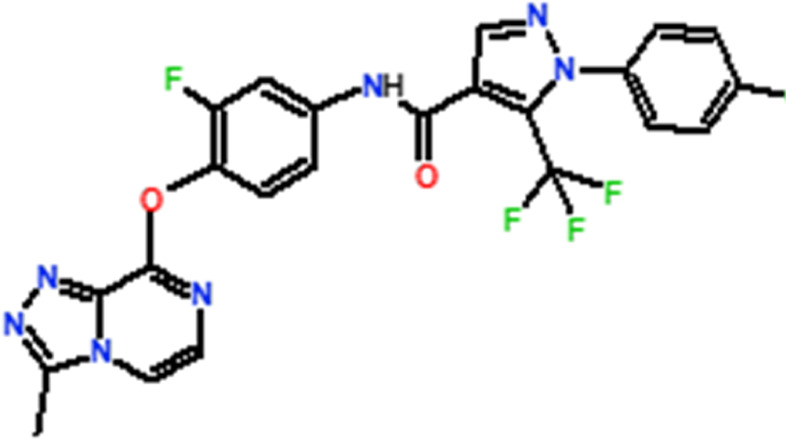
TABLE 2.
The 3D-QSAR model’s predicted activity pIC50 (Pred).
| Compounds | Structures | Activity estimated pIC50 | Binding affinity (Kcal/mol) | |
|---|---|---|---|---|
| CoMFA | CoMSIA | |||
| T01 |
|
6.430 | 6.594 | −9.6 |
| T02 |
|
6.182 | 6.263 | −9.7 |
| T03 |
|
6.166 | 6.502 | −10 |
| T04 |
|
6.357 | 6.614 | −8.9 |
| T05 |
|
5.808 | 6.482 | −9.8 |
| T06 |
|
6.136 | 6.368 | −10 |
| 22 |
|
5.83 | 5.82 | −8.8 |