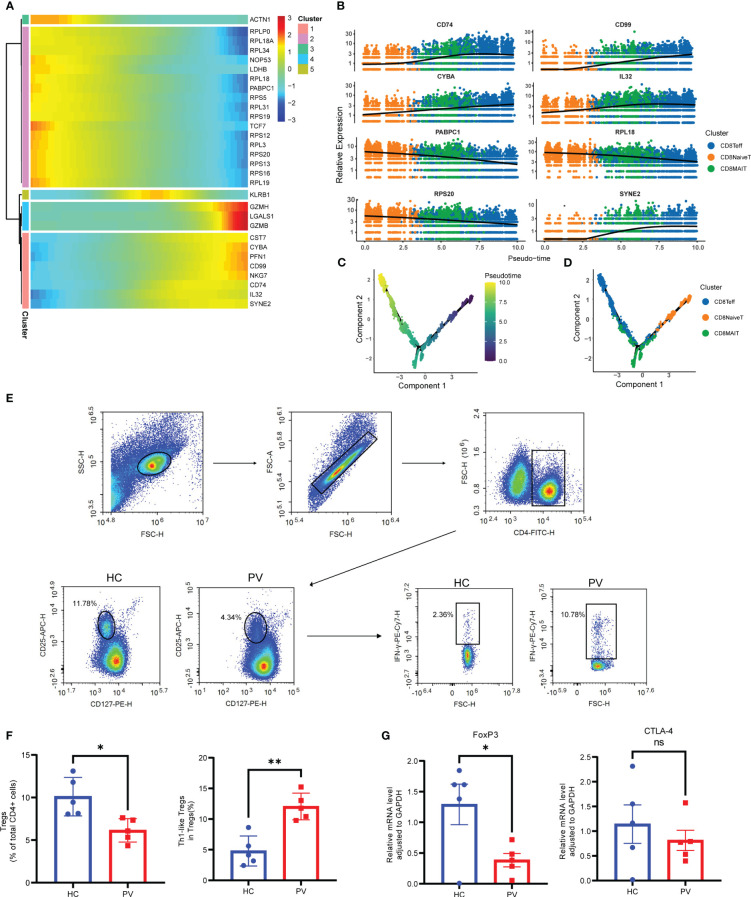
Figure 3.
Analysis of CD8+ T cells differentiation trajectories; flow cytometry and qPCR validation of Tregs and Th1-like Tregs. (A) Heatmap showing the dynamic changes of gene expression along pseudotime. (B) The trajectory of six typical genes. Unsupervised transcriptional trajectory from Monocle, colored by pseudotime (C) and cell clusters (D). (E) Representative gating strategy of flow cytometry analysis for proportion of Tregs (CD4+CD25+CD127low/-) in CD4+ T cells and Th1-like Tregs (IFN-γ+ Treg) in Tregs. (F) Flow cytometry analysis of Tregs and Th1-like Tregs. (G) Analysis of FoxP3 and CTLA-4 mRNA expression by qPCR. Data are expressed as mean ± SEM and significance was set at *p ≤ 0.05, **p ≤ 0.01.

