Figure 6.
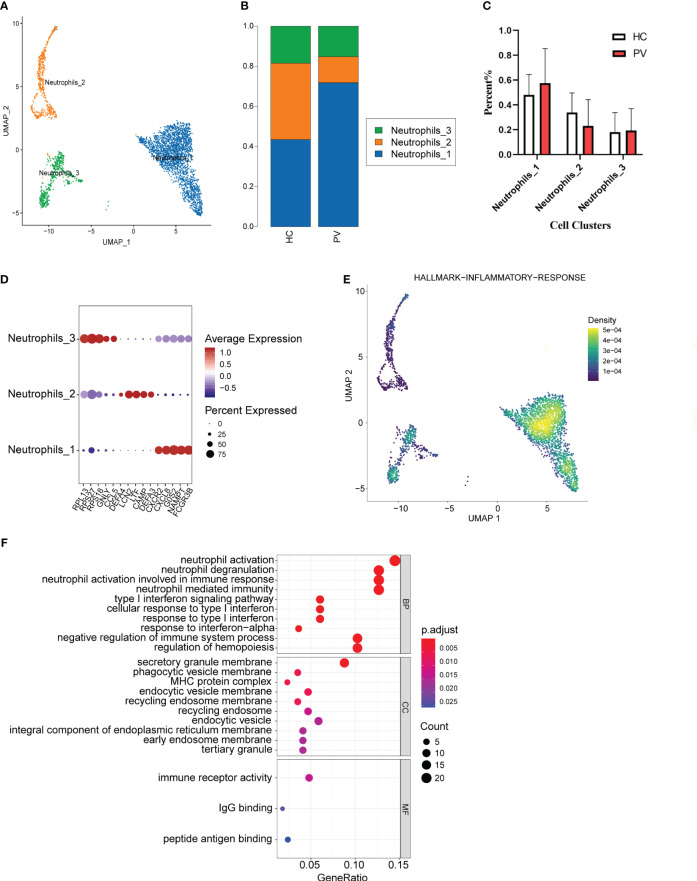
The heterogeneity and transcriptional features of neutrophils in PV patients. (A) UMAP representation of neutrophils, showing the formation of three clusters. (B) The fraction of cells for three types in HCs and PV patients. (C) Bar graphs of each cell cluster population between HCs and PV patients. (D) Bubble plot of top5 gene expression in each cell cluster; the size of the bubble represents the percentage of expressed cells; the color represents the average expression of each gene in clusters: red means the high expression. (E) UMAP plot of distribution of inflammatory response pathway in neutrophils. (F) The dotplot of GO pathways of the DEGs in Neutrophils_3 of PV patients.

