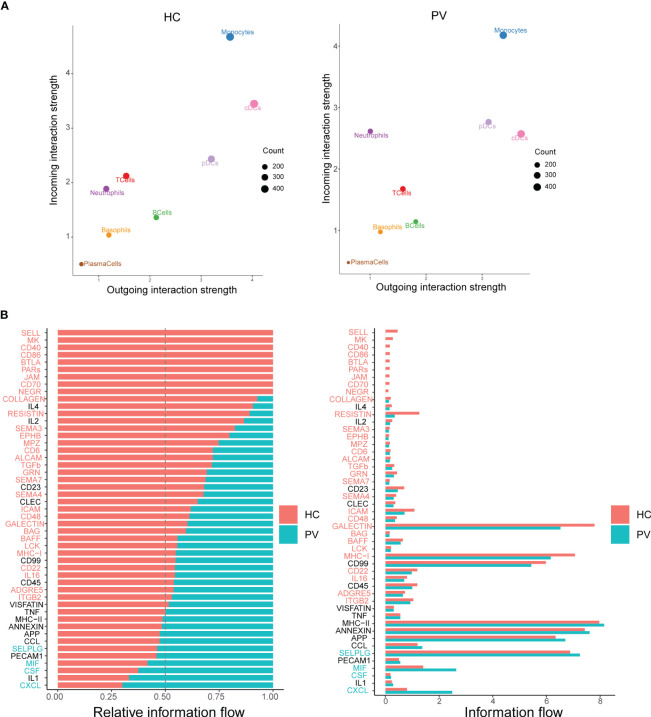
Figure 7.
Differential communication patterns in HCs and PV patients. (A) Scatter plot of incoming and outgoing interaction strength of each cell population in HCs and PV patients. (B) Significant signaling pathways were ranked based on differences in the overall information flow within the inferred networks between HCs and PV patients. The signaling pathways depicted in red are enriched in HCs, and those depicted in green were enriched in PV patients.

