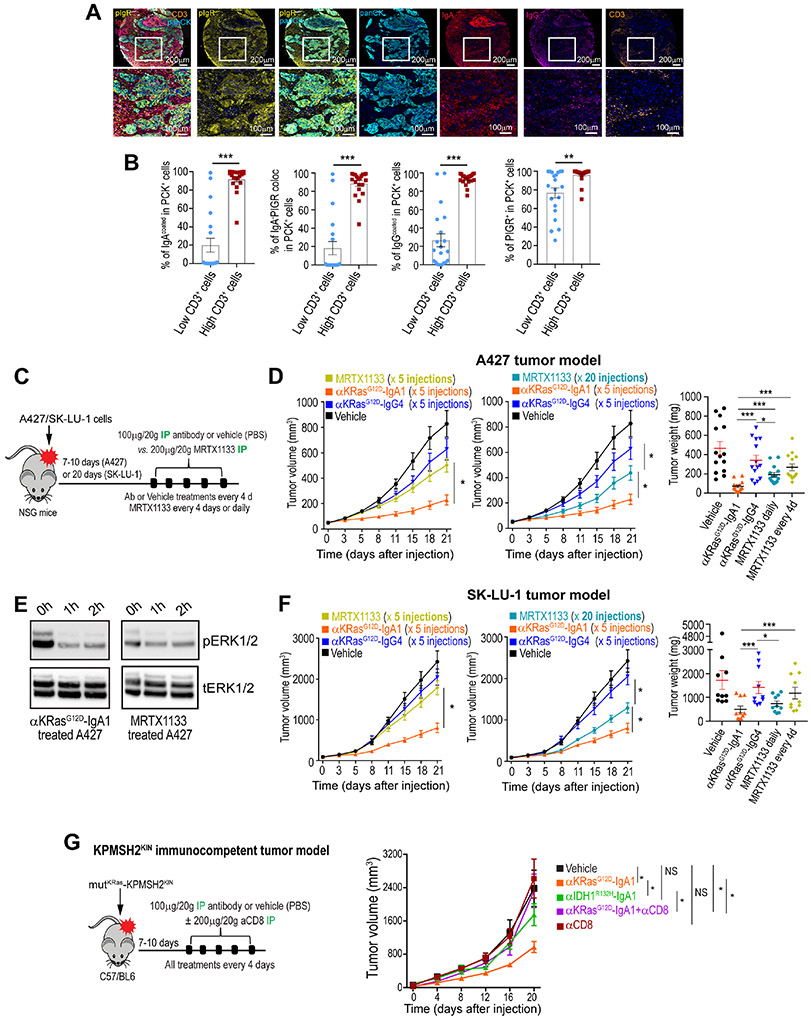
Figure 5. KRASG12D-specific dIgA1 is more effective than small molecule KRASG12D inhibitors at abrogating the progression of KRASG12D NSCLC.
(A) Combined staining of pIgR, IgA, IgG, CD3, Pan cytokeratin (panCK) and DAPI, representative of 30 clinical cases of squamous cell carcinoma or adenocarcinoma of the lung. Scale bar, 200 μm (upper panel), 100 μm (magnified lower panels). (B) Accumulation of CD3+ T cells in human panCK+ NSCLC islets are associated with increased coating of tumor cells with IgA and IgG, expression of pIgR and colocalization of IgA with pIgR. Data are mean ± SEM. **P≤0.01; ***P≤0.001, unpaired two-tailed t-test. (C) Schematic of design of experiment shown in D&E. Antibody (100 μg per 20 g body weight), or equal volume of vehicle (PBS) were administered every 4 days, while MRTX1133 (200 μg per 20 g body weight) was administered daily or every 4 days, as indicated. All treatments were IP injected. (D) Tumor growth curves from KRASG12D A427 tumor-bearing NSG mice receiving (IP) anti-KRASG12D-IgA1, anti-KRASG12D-IgG4 or vehicle every 4 days. MRTX1133 was administered in different mice every 4 days (left) or daily (middle), as indicated. Tumor weight is shown on the right. Growth curves and tumor weights were pooled from 3 independent experiments (n=14 mice per group, toI). (E) Western blot showing phosphorylated and total ERK1/2 in lysates of KRASG12D-mutated A427 cells, treated with anti-KRASG12D-IgA1 or MRTX1133. (F) Identical treatment as in ‘D’ of advanced KRASG12D-mutated SK-LU-1 lung cancers. Growth curves and tumor weights were pooled from 3 independent experiments (n=14 mice per group, total). (G) Left, schematic design of treatments in KPMSH2KIN lung tumor-bearing immunocompetent mice. Antibody (100 μg per 20 g body weight) or equal volume of vehicle (PBS) was IP injected. When indicated, CD8 T cells were depleted with intraperitoneal anti-CD8 antibodies. Right, Tumor growth curves from mice receiving intraperitoneal vehicle or anti-KRASG12D-dIgA1, or anti-IDH1R132H-dIgA1, with or without CD8 T cell depletion. Growth curves were pooled from 2 independent experiments (n=8-10 mice per group). Data are mean ± SEM. *P ≤ 0.05, **P ≤ 0.01, ***P ≤ 0.001; paired two-tailed t-test (D&F) and non-parametric Wilcoxon test (G) for growth curves or unpaired two-tailed t-test for tumor weights. Data S3 provides details of statistics.

