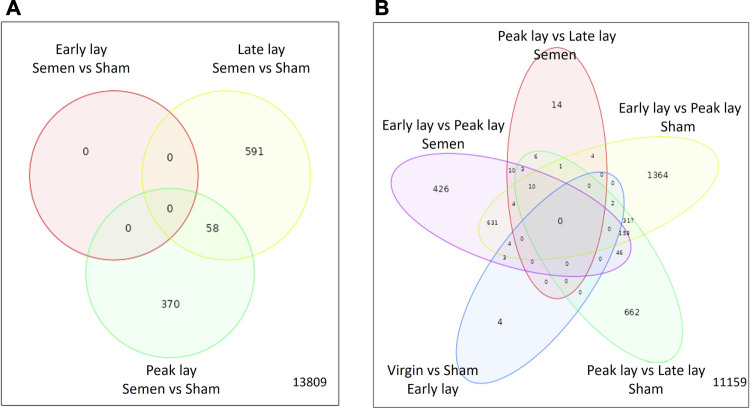
FIGURE 5.
Characterization of differentially expressed genes in the UVJ. Venn diagrams show the number of common and unique differentially expressed genes in the semen vs. sham comparison at early lay, peak lay, and late lay (A) and among production stages comparisons in semen- and sham-inseminated groups (B).

