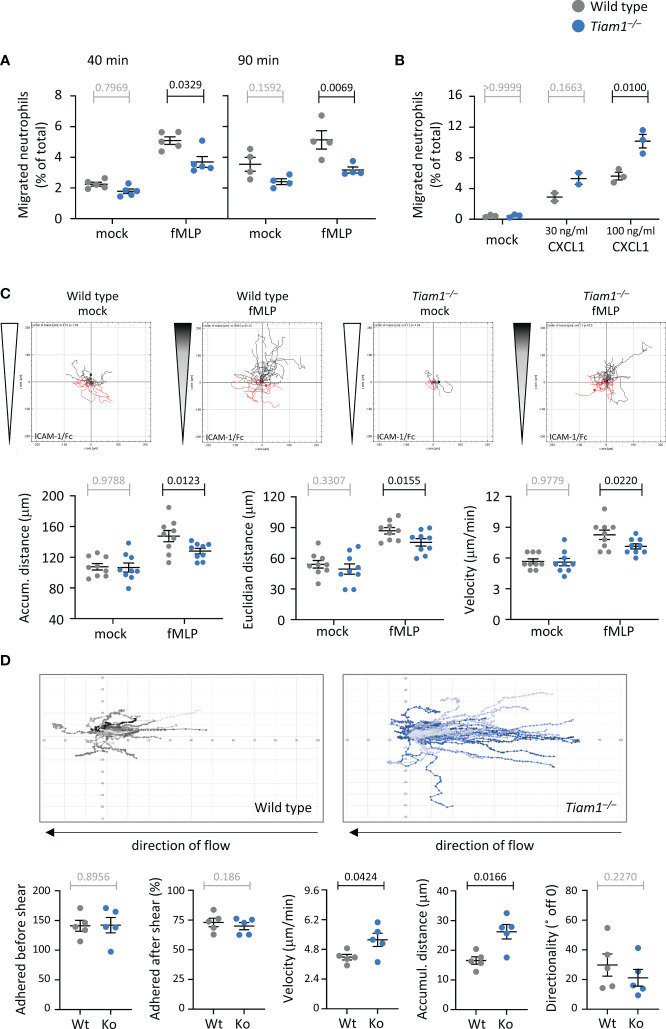
Figure 5.
Tiam1 is required for neutrophil chemotaxis but limits migration under shear stress. (A) Transwell chemotaxis with fMLP. Wild type (grey symbols) and Tiam1–/– (blue symbols) bone marrow cells were primed with 50 ng/ml GM-CSF and 20 ng/ml TNFα for 45 min at 37˚C before seeding into the upper well of a transwell chemotaxis chamber (3 μm pores) with either 1 μM fMLP or buffer (mock) in the lower chamber and incubation for 40 or 90 min, as indicated. Neutrophils recovered from the lower chamber were identified by flow cytometry. Data are mean ± SEM of 4-5 independent experiments; each dots is the mean of one experiment. Statistics are three-way ANOVA with Sidak’s multiple comparisons test. (B) Transwell chemotaxis with CXCL1. Wild type and Tiam1–/– cells were treated as in (A) except with 30 ng/ml or 100 ng/ml CXCL1 as the chemoattractant for 40 min. Data are mean ± SEM of 3 independent experiments (2 for 30 ng/ml). Statistics are two-way ANOVA with Sidak’s multiple comparisons test. (C) Chemotaxis on ICAM1. Purified wild type and Tiam1–/– neutrophils were primed as in (A), plated into an ICAM1-coated ibidi chamber (µ-slide VI 0.4), and their migration in a chemoattractant gradient with 10 µM fMLP as the highest concentration (shaded wedges, fMLP), or in buffer only (white wedges, mock), was imaged for 20 min. Cells were tracked in the steepest area of the gradient. Tracks from one representative experiment are shown. Data are mean ± SEM of 9 independent experiments; each dot is the mean of one experiment. (D) Adhesion and migration on ICAM1 under shear-stress. Wild type and Tiam1–/– neutrophils were primed as in (A) and plated into ICAM1-coated 6-channel ibidi slides. Cells were left to adhere for 15 min at 37°C before shear flow of 6 dyn was applied, and samples were live-imaged by widefield microscopy for 10 min, with image acquisition every 10 s. Cell tracks were generated and analysed for the indicated behaviours using Fiji. Representative tracks from one experiment are shown. Data are mean ± SEM of 5 independent experiments, with 6 samples per genotype in each experiment; each dot is the mean of one experiment. Statistics in (B, C) are two-way ANOVA with Sidak’s multiple comparisons test. (A–C) P-values in black denote significant differences, p-values in grey are non-significant.

