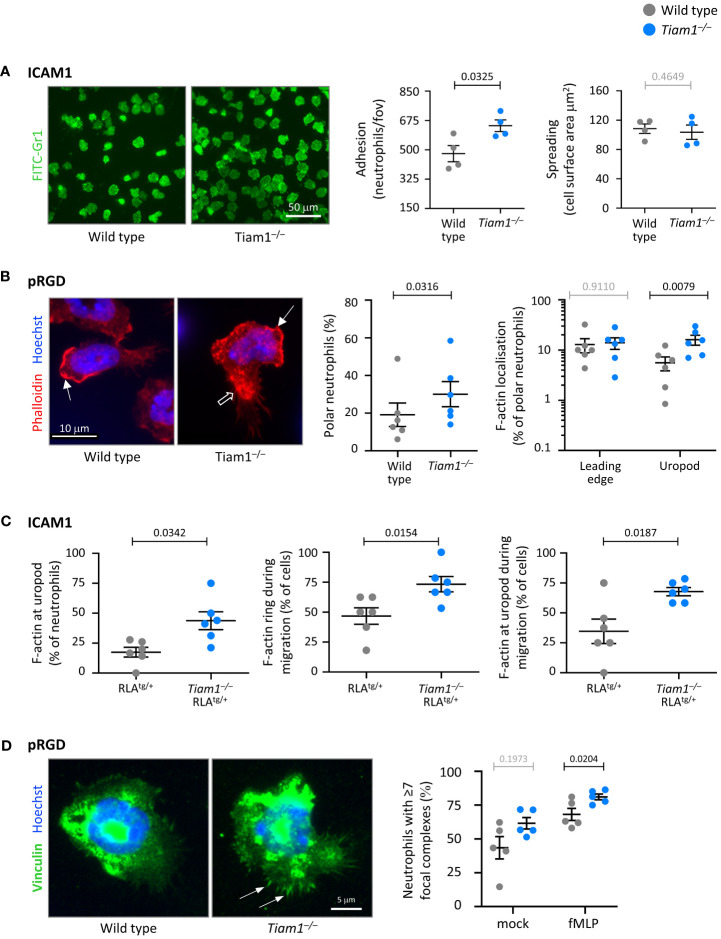
Figure 6.
Tiam1 limits neutrophil adhesion, polarity and focal adhesions, and determines F-actin dynamics. (A) Adhesion and spreading. Wild type (grey symbols) and Tiam1–/– (blue symbols) neutrophils were prewarmed, plated onto ICAM1-coated coverslips for 10 min at 37˚C, fixed, stained with FITC-Gr1 antibody and imaged by widefield fluorescence microscopy. Representative images from one experiment are shown. Cell masks were generated. Adhesion was quantified as the number of neutrophils per fov; spreading as the surface area of each cell mask. Data are mean ± SEM of 4 independent experiments, with 27 fov per coverslip and duplicate coverslips per condition assessed in each experiment; each dot is the mean of one experiment. Statistics are two-way ANOVA with Sidak’s multiple comparisons test. (B) Cell and F-actin polarity. Wild type and Tiam1–/– neutrophils were allowed to adhere to pRGD-coated coverslips for 15 min at 37°C, fixed, permeabilised, and stained with phalloidin-Atto 655 and Hoechst 33342. Cell morphology and F-actin localisation were analysed using widefield fluorescence microscopy, with images blinded prior to analysis. Representative images from one experiment are shown. Closed arrows denote F-actin at the leading edge, open arrows F-actin at the uropod. Data are mean ± SEM of 6 independent experiments, with 35-96 cells per genotype assessed in each experiment; each dot is the mean of one experiment. Statistics for cell polarity are paired t-test, for F-actin distribution two-way ANOVA with Sidak’s multiple comparisons test. (C) F-actin dynamics. RubyLifeact (RLAtg/+) and Tiam1–/– RLAtg/+ neutrophils were primed with 50 ng/ml GM-CSF, 20 ng/ml TNFα for 45 min at 37˚C. RLAtg/+ neutrophils were stained with CellTracker, mixed with unstained Tiam1–/– RLAtg/+ neutrophils, plated onto ICAM1 with 0.75 µM fMLP, and live-imaged by widefield fluorescence microscopy for 20 min from the moment they started to adhere. See also Supplementary Movie 1 . Data are mean ± SEM of 6 independent experiments, with movies of 90 RLAtg/+ and 131 Tiam1–/– RLAtg/+ neutrophils analysed; each dot is the mean of one experiment. Statistics are paired t-test. (D) Focal complexes. Wild type and Tiam1–/– neutrophils were allowed to adhere to pRGD for 15 min at 37°C in the presence or absence of 0.75 µM fMLP. Cells were fixed, permeabilised, stained with vinculin antibody and Hoechst 33342, imaged by widefield fluorescence microscopy, and images blinded prior to analysis. Representative images are from one experiment in the presence of fMLP; arrows denote focal complexes. Data mean ± SEM of 5 independent experiments, with 37-80 cells analysed per condition; each dot is the mean of one experiment. Statistics are two-way ANOVA with Sidak’s multiple comparisons test. (A–D) P-values in black denote significant differences, p-values in grey are non-significant.

