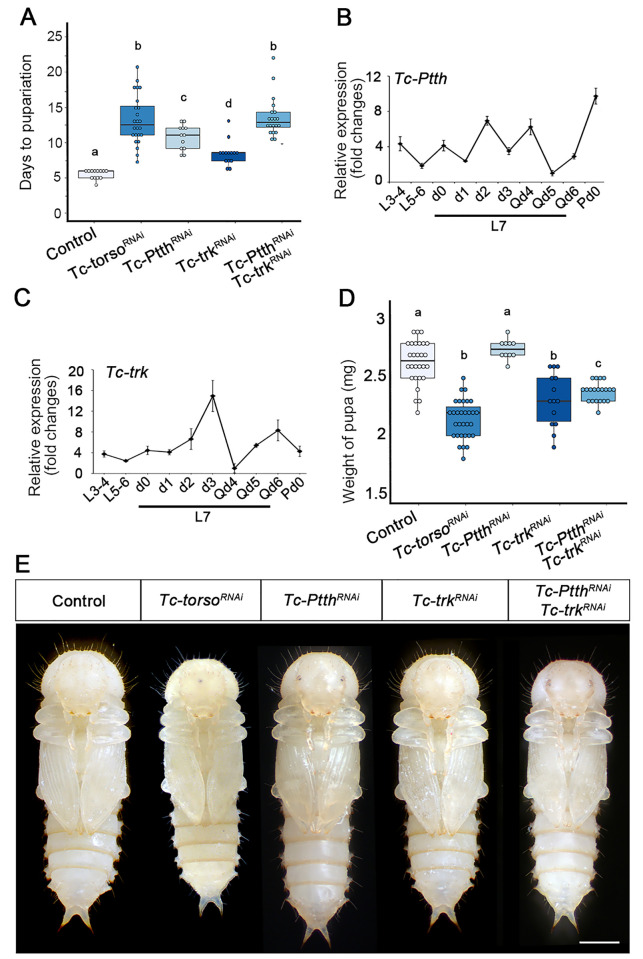
Fig 2. Activation of Tc-Torso by Tc-Ptth and Tc-Trk during the final larval stage of Tribolium.
(A) Developmental duration of the last larval stage (L7) in newly molted L6 larvae injected with dsMock (Control) (n = 13), dsTc-torso (n = 33), dsTc-Ptth (n = 12), dsTc-trk (n = 14), and dsTc-Ptth + dsTc-trk (n = 16). (B-C) Temporal changes in Tc-Ptth mRNA (B) and Tc-trk mRNA (C) levels measured by qRT-PCR during larval development, from L3-4 to pupa day 0 (Pd0). Transcript abundance values are normalized against the Tc-Rpl32 transcript. Error bars indicate the standard error of the mean (SEM) (n = 5). (D) Body weight of the of Control (n = 10), Tc-torsoRNAi (n = 10), Tc-PtthRNAi (n = 12), Tc-trkRNAi (n = 14), and Tc-PtthRNAi + dsTc-trkRNAi (n = 16) larvae pupae. All weights were measured on day 0 of the pupal instar. (E) Ventral view of a Control and Tc-torsoRNAi, Tc-PtthRNAi, Tc-trkRNAi, and Tc-PtthRNAi + Tc-trkRNAi pupa. Scale bar represents 0.5 mm. In A and D, boxplots are used to represent the data, with black lines indicating medians, colored boxes showing the IQR, and bars indicating the upper and lower values. Values > ±1.5 x the IQR outside the box are considered outliers. Different letters represent groups with significant differences based on an ANOVA test (Tukey, p < 0.001). Raw data of A, B, C and D are in S1 Data (tab Fig 2).

