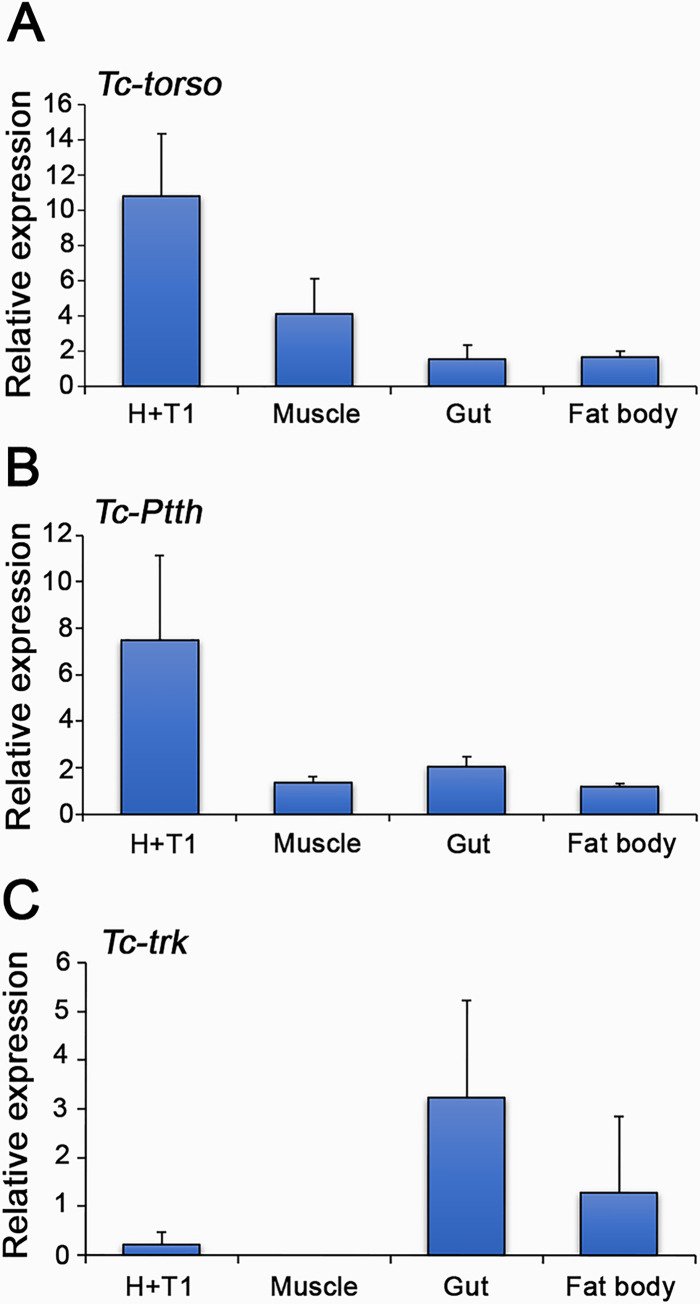
Fig 3. Tissue specific expression of Tc-torso, Tc-Ptth and Tc-trk.
(A) Tc-torso, (B) Tc-Ptth and (C) Tc-trk mRNA levels measured by qRT-PCR in head and first thoracic segment (H+T1), muscle, gut and fat body of day 2 L7 larvae. For transcript analysis, equal amounts of total RNA were used. Error bars indicate the SEM (n = 5). Raw data are in S1 Data (tab Fig 3).

