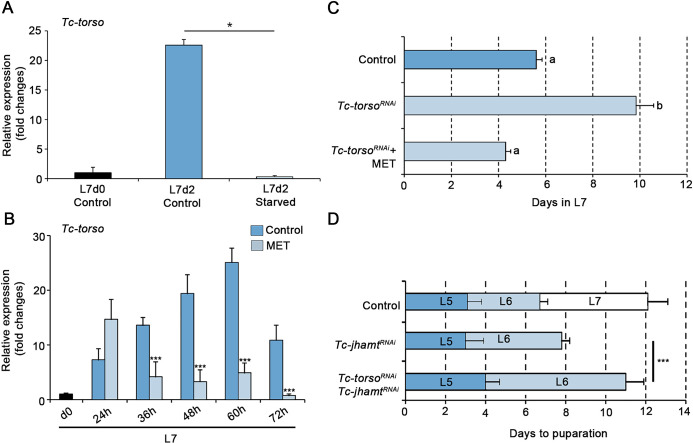
Fig 4. Juvenile Hormone (JH) regulation of Tc-torso expression in Tribolium.
(A) Temporal changes in Tc-torso mRNA levels measured by qRT-PCR in Control and starved animals at the indicated stages. Transcript abundance values were normalized against the Tc-RpL32 transcript. Average values of three independent datasets are shown with standard errors (n = 4–8). Asterisks indicate statistically significant differences at *p < 0.1 (t-test). (B) Tc-torso mRNA levels measured by qRT-PCR during the L7 larval instar of Control and methoprene-treated animals (MET). Note the dramatic decrease in Tc-torso transcription upon methoprene application. Transcript abundance values were normalized against the Tc-RpL32 transcript. Error bars indicate the SEM (n = 5). Asterisks indicate statistically significant differences at ***p ≤ 0.001 (t-test). (C) Developmental duration of the last larval stage (L7) in newly molted L6 larvae injected with dsMock (Control) (n = 20), dsTc-torso (n = 23), and dsTc-torso + methoprene (n = 23). The developmental delay induced by depletion of Tc-torso is abolished by the application of methoprene. (D) Developmental progression of newly molted L4 larvae after injection with either dsMock (Control) (n = 15), dsTc-jhamt (n = 25) or dsTc-torso + dsTc-jhamt (n = 21). The bars represent the mean ± standard deviation (SD) for each developmental stage observed after the double-stranded RNA injection. Error bars indicate the SEM. Different letters represent groups with significant differences according to an ANOVA test (Tukey, p < 0.001). Raw data are in S1 Data (tab Fig 4).

