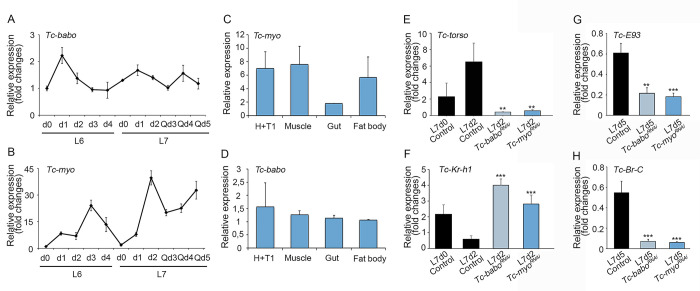
Fig 5. TGFß/Activin signaling pathway activates Tc-torso expression through the repression of JH synthesis.
(A-B) Temporal changes in Tc-babo (A) and Tc-myo (B) mRNA levels measured by qRT-PCR in penultimate (L6) and ultimate (L7) instar larvae. Transcript abundance values were normalized against the Tc-Rpl32 transcript. Error bars indicate the standard error of the mean (SEM) (n = 5). (C) Tc-myo, and (D) Tc-trk mRNA levels measured by qRT-PCR in head and first thoracic segment (H+T1), muscle, gut and fat body of day 2 L7 larvae. For transcript analysis, equal amounts of total RNA were used. Error bars indicate the SEM (n = 3). (E-H) Temporal changes in transcript levels of Tc-torso (E), Tc-Kr-h1 (F), Tc-E93 (G), and Tc-Br-C (H) measured by qRT-PCR at the indicated time points of L7 Control, Tc-baboRNAi, and Tc-myoRNAi larvae. Transcript abundance values were normalized against the Tc-Rpl32 transcript. Average values of three independent datasets are shown with standard errors (n = 5–8). Asterisks indicate statistically significant differences at **p < 0.01 and ***p < 0.001 (A t-test was used to compare the levels of gene expression for Tc-baboRNAi, and Tc-myoRNAi with the L7d2 control). Raw data are in S1 Data (tab Fig 5).

