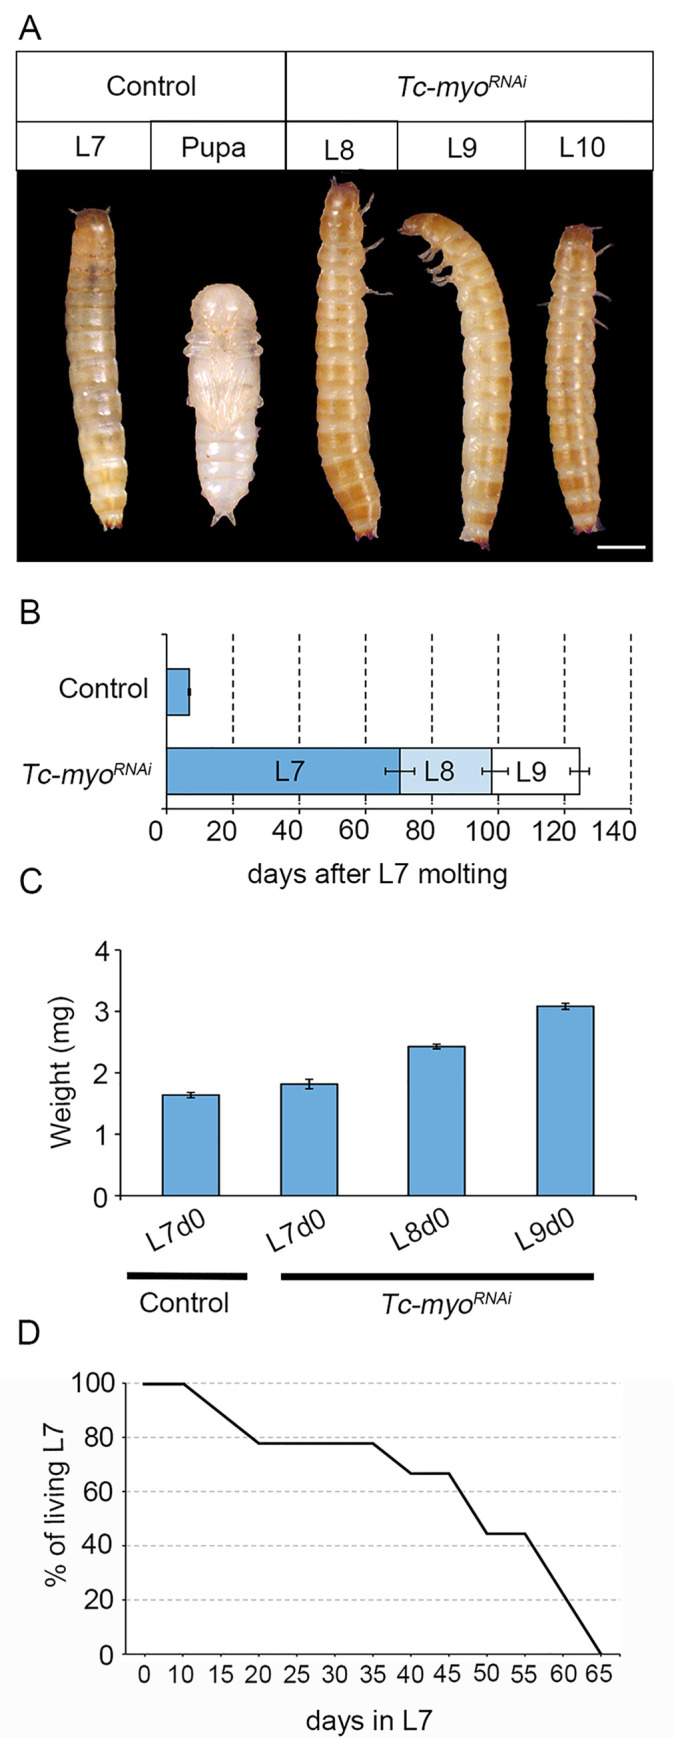
Fig 6. Impairment of metamorphosis upon inactivation of TGFß/Activin signaling.

(A) Dorsal and ventral view of a Control L7 larva and pupa respectively, and dorsal views of supernumerary L8, L9, and L10 Tc-torsoRNAi animals. Scale bar, 0.5 mm. (B) Temporal progression of L6 larvae injected with dsMock (Control) (n = 6) or with dsTc-myo (n = 15) and left until the ensuing molts. Each bar indicates the periods (mean ± SD) for each developmental stage after the molt into the L7 larval stage. (C) Growth in body weight of Control and Tc-myo animals. All weights are measured on day 0 of each instar. Bars indicate the mean ± SD (n = 8). (D) Percentage of Tc-babo depleted larvae alive recorded for each day after the molt into the L7 larval stage (n = 45). Raw data of B, C and D are in S1 Data (tab Fig 6).
