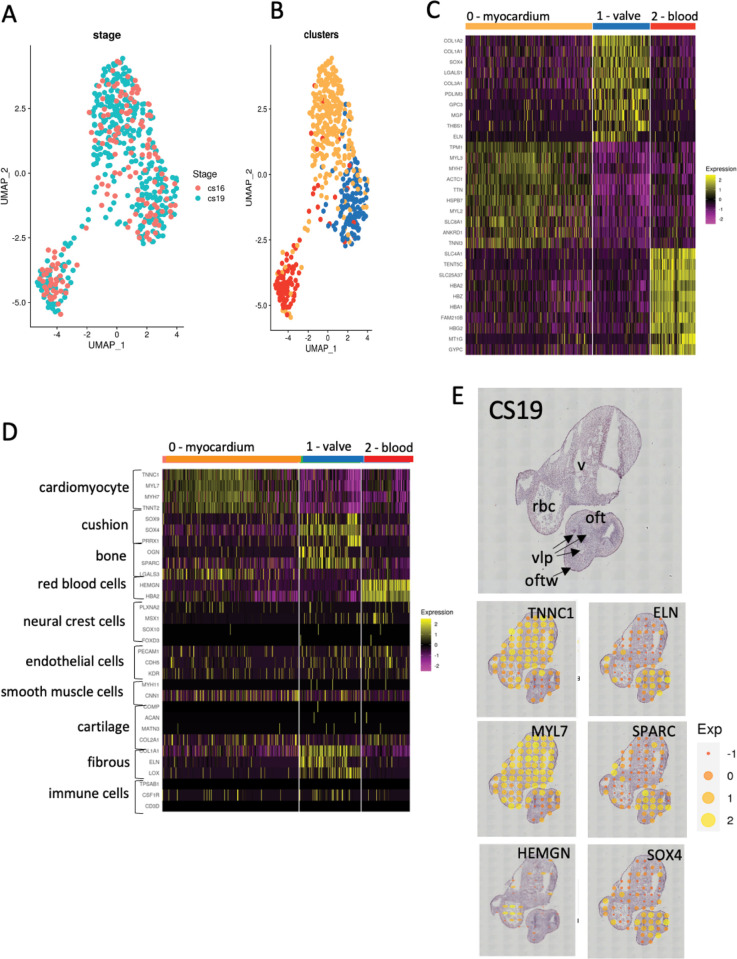
Fig 2. Cluster analysis.
A) UMAP projection showing overlap of data between sections from the CS16 (orange dots) and CS19 (turquoise dots) embryos. B) UMAP projection showing clustering of combined CS16 and CS19 data, again showing three clusters (red, blue and orange dots). C) Heat map showing top 10 genes in each cluster, highlighting the gene expression differences between the three clusters. At this stage, based on the expressed genes, putative tissue types can be proposed as myocardium (orange), cushion (blue) and blood (red). D) Perfect marker analysis using recognised markers for specific cardiac cell types confirms the orange cluster as myocardium, the red cluster as blood cells, and shows that the putative cushion cluster has characteristics of cushions, bone and fibrous tissue, and thus should be better named as “valve” as this implies the entire structure, not just the developing leaflets. E) Mapping “perfect markers” back to the H&E sections shows that they localise to the expected areas (compare to Fig 1D). The H&E section shows the identity of the tissues and structures contained within the section. oft = outflow tract, oftw = outflow tract wall, rbc = red blood cells (in lumen), v = ventricular myocardium, vlp = valve leaflet primordia.

