
Figure 6. Spines having a mitochondrion in the head or neck are more selective for visual features.
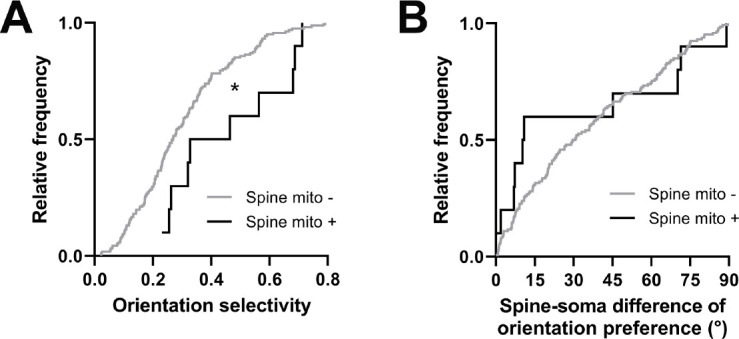
(A) Cumulative frequency distribution of orientation selectivity for spines that have a mitochondrion in the head or neck (black, n=10 spines, shown in Figure 1C) versus spines that do not (gray). (B) Spine-soma difference of orientation preference. Mann-Whitney U tests, *p<0.05.