. 2023 Dec 7;12:RP88658. doi: 10.7554/eLife.88658

Figure 4. Hsp90α/β KO cells maintain chaperones, co-chaperones, and Hsp90 interactors during chronic stress adaptation.

(A) Volcano plots of the normalized fold changes of molecular chaperones and co-chaperones after 1 and 4 days (first and second rows, respectively) of chronic HS determined by quantitative label-free proteomic analyses of Hsp90α/β KO and WT HEK cells. Each genotype was compared with its respective 37 °C control (n=3 biologically independent samples). Log2 fold changes of >0.5 or <–0.5 with q-values (adjusted p-values) of <0.05 (indicated as stippled lines) were considered significant differences for a particular protein. (B) Immunoblots of different molecular chaperones in HEK WT and Hsp90α/β KO cells (α KO, Hsp90αKO; β KO, Hsp90βKO). GAPDH serves as the loading control for all three panels (representative of n=2 independent experiments). (C) Volcano plots of the normalized fold changes of the Hsp90 interactors (list obtained from https://www.picard.ch/Hsp90Int) after 4 days of chronic HS determined by quantitative label-free proteomic analyses of Hsp90α/β KO and WT HEK cells. Each genotype was compared with its respective 37 °C control (n=3 biologically independent samples). (D and E) In vivo refolding of heat-denatured luciferase of control cells (blue line) and cells heat-adapted to 39 °C (orange line). Luciferase activity before the acute HS (at 43 °C) is set to 100% (n=3 biologically independent samples). See scheme of the experiment below. Note the different scales of the Y axes of the bar graphs in panel E. The data are represented as mean values ± SEM for all bar graphs. The statistical significance between the groups was analyzed by two-tailed unpaired Student’s t-tests. The p-values for Hsp90α and Hsp90β KO cells are in blue and red, respectively. All p-values are for comparisons to the respective WT.

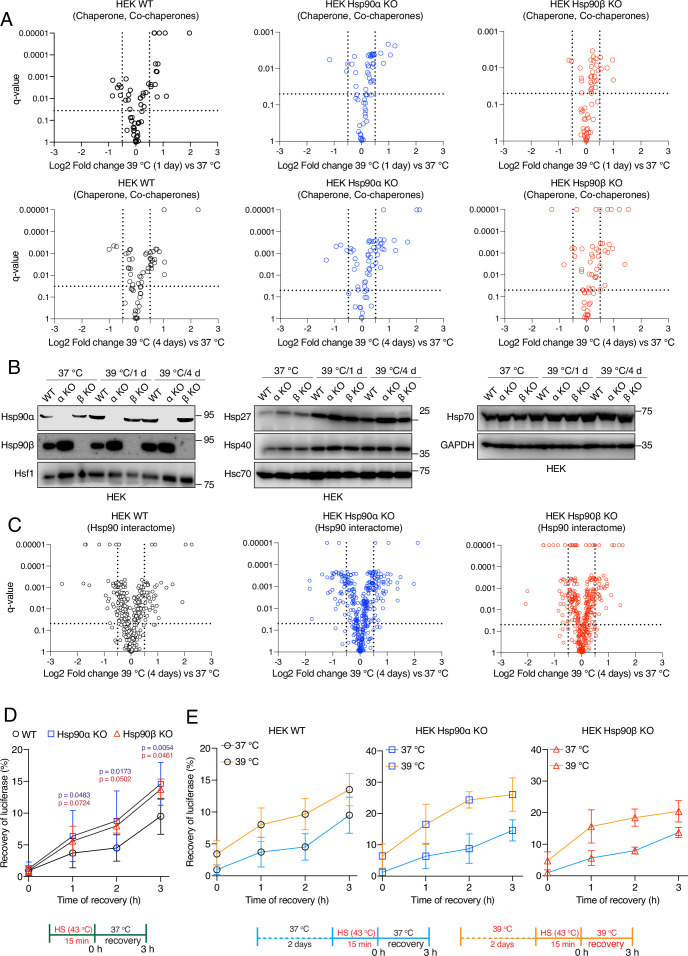
Figure 4—source data 1. Raw and annotated immunoblots.
Figure 4—source data 2. Values related to all graphs.

Figure 4.

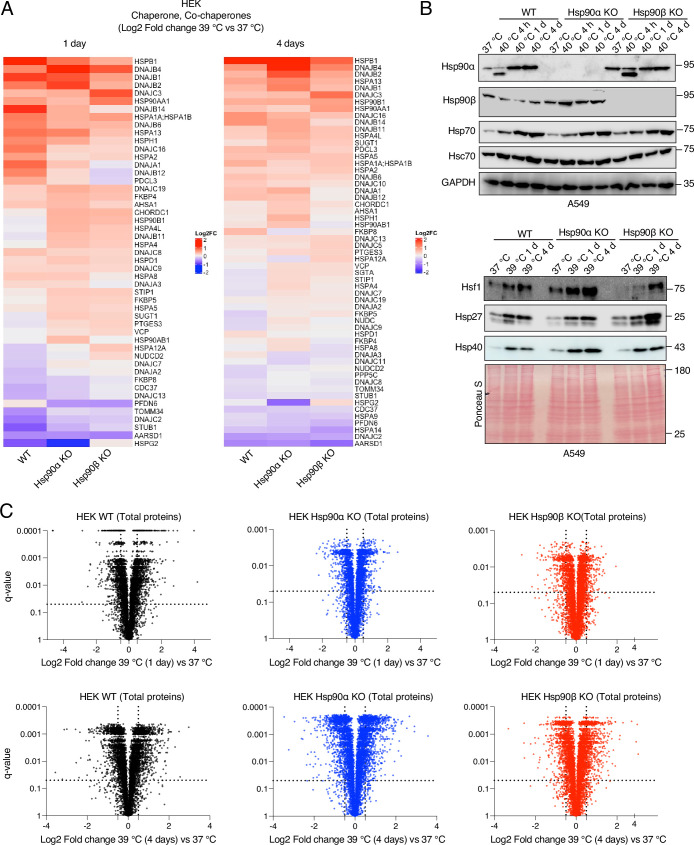
Figure 4—figure supplement 1. Hsp90α/β KO cells maintain molecular chaperones, co-chaperones, and total proteins.

Figure 4—figure supplement 1.

(A) Heat maps of the normalized fold changes (log2) of molecular chaperones and co-chaperones of HEK cells subjected to 1 and 4 days of chronic HS as determined by quantitative label-free proteomics (n=3 biologically independent samples); only proteins whose abundance changed with q-values (adjusted p-values) of <0.05 were considered significant and are shown in the heat map (extracted from Source data 1). (B) Immunoblots of some molecular chaperones of A549 WT and Hsp90α/β KO cells. GAPDH and the Ponceau S-stained nitrocellulose filter serve as loading controls. (C) Volcano plots of the normalized fold changes of total proteins of cells subjected to chronic HS for 1 and 4 days (first and second rows, respectively) determined by quantitative label-free proteomics (extracted from Source data 1). Each genotype was compared with its respective 37 °C control (n=3 biologically independent samples). Log2 fold changes of >0.5 or <–0.5 with q-values (adjusted p-values) of <0.05 were considered significant differences for a particular protein.
Figure 4—figure supplement 1—source data 1. Raw and annotated immunoblots of Figure 4—figure supplement 1.
Figure 4—figure supplement 2. Hsp90α/β KO cells maintain Hsp90 interactors in chronic stress.

Figure 4—figure supplement 2.

Heat maps of the normalized fold changes (log2) of Hsp90 interactors of HEK cells subjected to 1 and 4 days of chronic HS as determined by quantitative label-free proteomics (n=3 biologically independent samples); only proteins whose abundance changed with q-values (adjusted p-values) of <0.05 were considered significant and are shown in the heat map (extracted from Source data 1).