. 2023 Dec 7;12:RP88658. doi: 10.7554/eLife.88658

Figure 7. Hsp90 is crucial for cellular proteostasis during adaptation to chronic stress.

(A) Flow cytometric determination of the in vivo UPS activity in chronic HS compared to 37 °C, using the Ub-M-GFP and Ub-R-GFP reporter proteins (n=4 biologically independent samples). (B) Flow cytometric measurement of autophagic flux in chronic HS compared to 37 °C, using a mCherry-GFP-LC3 reporter. Flux is calculated as the ratio of the mean fluorescence intensities of mCherry and GFP-positive cells (n=4 biologically independent samples). (C) In vitro steady-state proteasomal activity with lysates of HEK WT, and Hsp90α and Hsp90β KO cells determined by measuring fluorescence of the cleaved substrate suc-LLVY-AMC (n=2 biologically independent samples). (D) Fluorescence micrographs of cells expressing the fusion protein EGFP-Q74 visible as aggregates with green fluorescence. The scale bars in the zoomable micrographs indicate 10 μm (images are representative of n=2 independent biological samples). The data are represented as mean values ± SEM for all bar graphs. The statistical significance between the groups was analyzed by two-tailed unpaired Student’s t-tests.

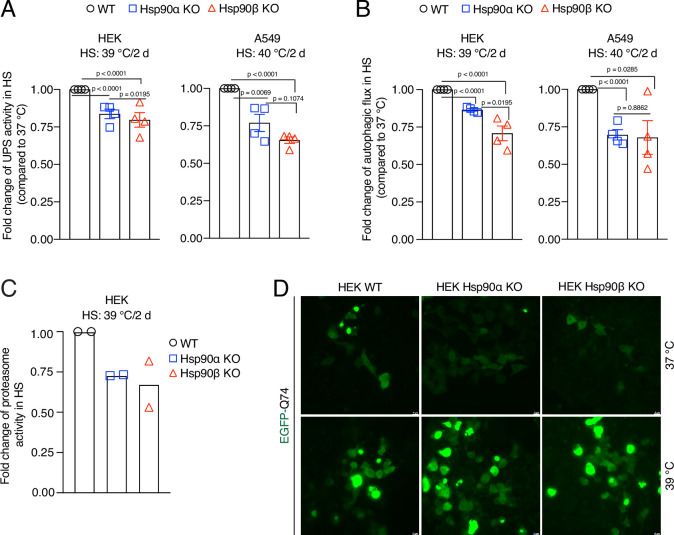
Figure 7—source data 1. Values related to all graphs.

Figure 7.

Figure 7—figure supplement 1. Hsp90α/β KO cells maintain WT levels of protein degradation activities in unstressed conditions, but have more protein aggregates.

Figure 7—figure supplement 1.

(A) Flow cytometric determination of the in vivo UPS activity using the Ub-M-GFP and Ub-R-GFP reporter plasmids (n=4 biologically independent samples). (B) Flow cytometric measurement of autophagic flux using a mCherry-GFP-LC3 reporter. Flux is calculated as the ratio of the mean fluorescence intensities of mCherry and GFP-positive cells (n=4 biologically independent samples). (C) Quantitation of the number of EGFP-Q74 aggregates per 100 cells from representative micrographs such as the ones of Figure 7D. For each bar, data are from six different experiments, each normalized to 100 cells. The data are represented as mean values ± SEM for all bar graphs. The statistical significance between the groups was analyzed by two-tailed unpaired Student’s t-tests.
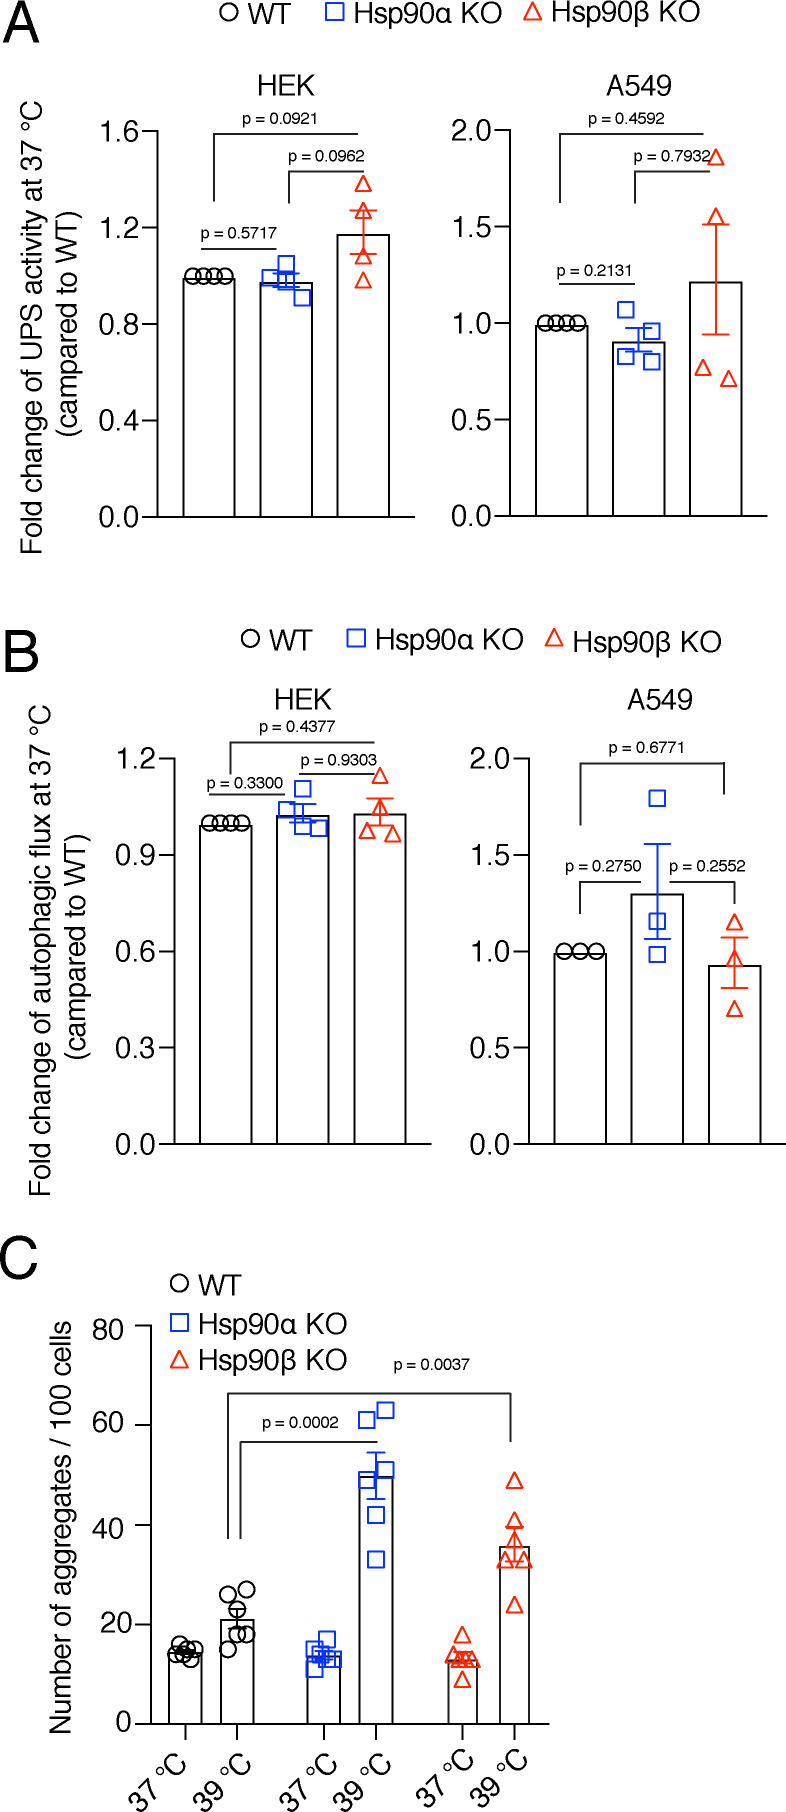
Figure 7—figure supplement 1—source data 1. Values related to all graphs of Figure 7—figure supplement 1.
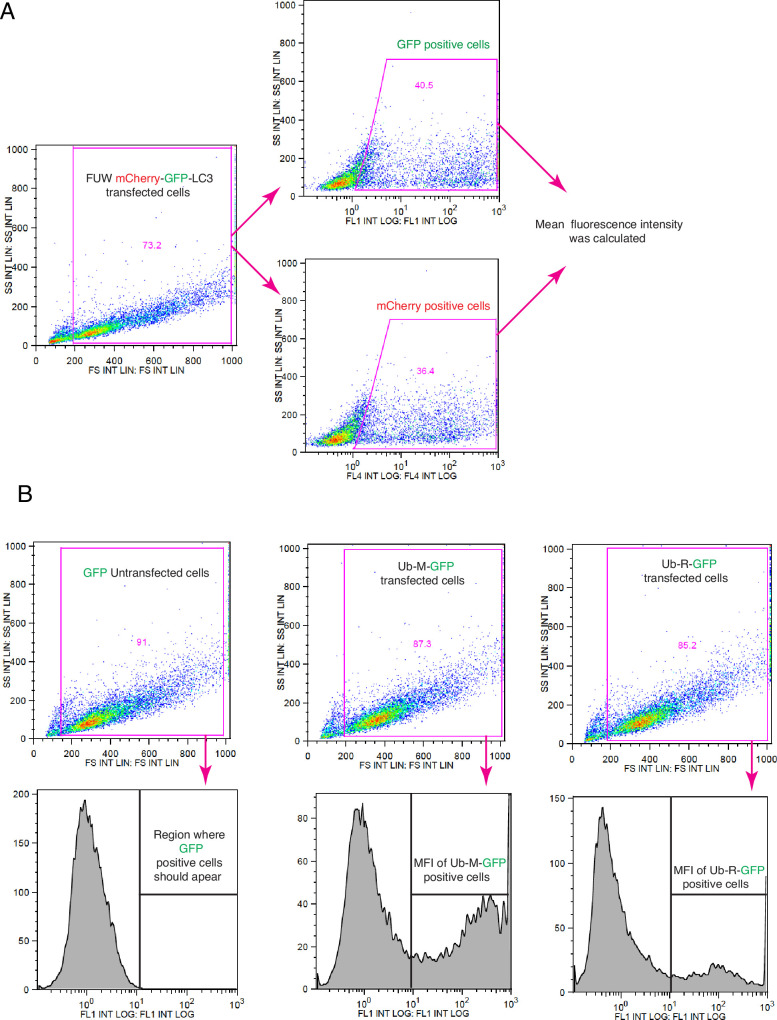
Figure 7—figure supplement 2. Schematic representation of the flow cytometric strategies for measuring autophagic flux and in vivo UPS activities.

Figure 7—figure supplement 2.

(A) Gating strategy for autophagic flux measurements, relevant to Figure 7B and Figure 7—figure supplement 1B. (B) Gating strategy for measuring UPS activity; related to Figure 7A and Figure 7—figure supplement 1A.