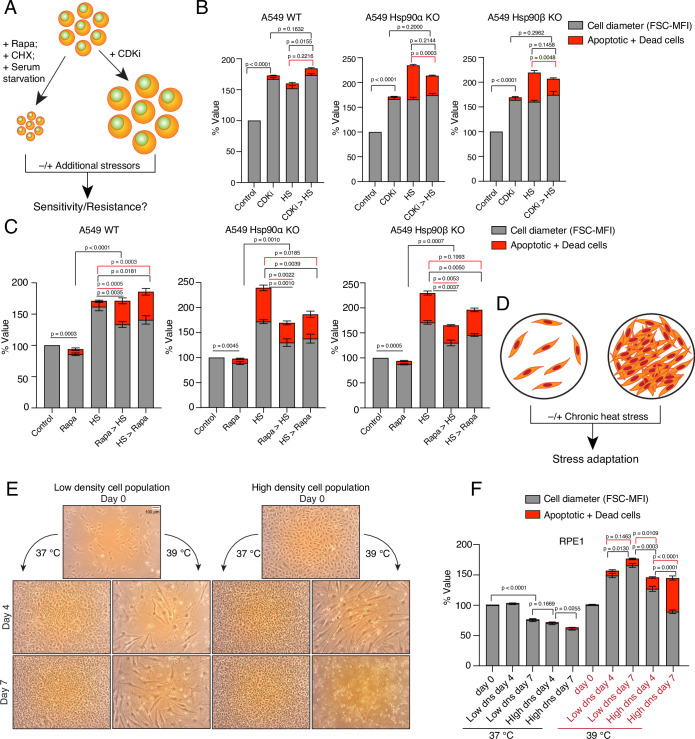
Figure 8. Enlarged cells are more resistant to additional stress.
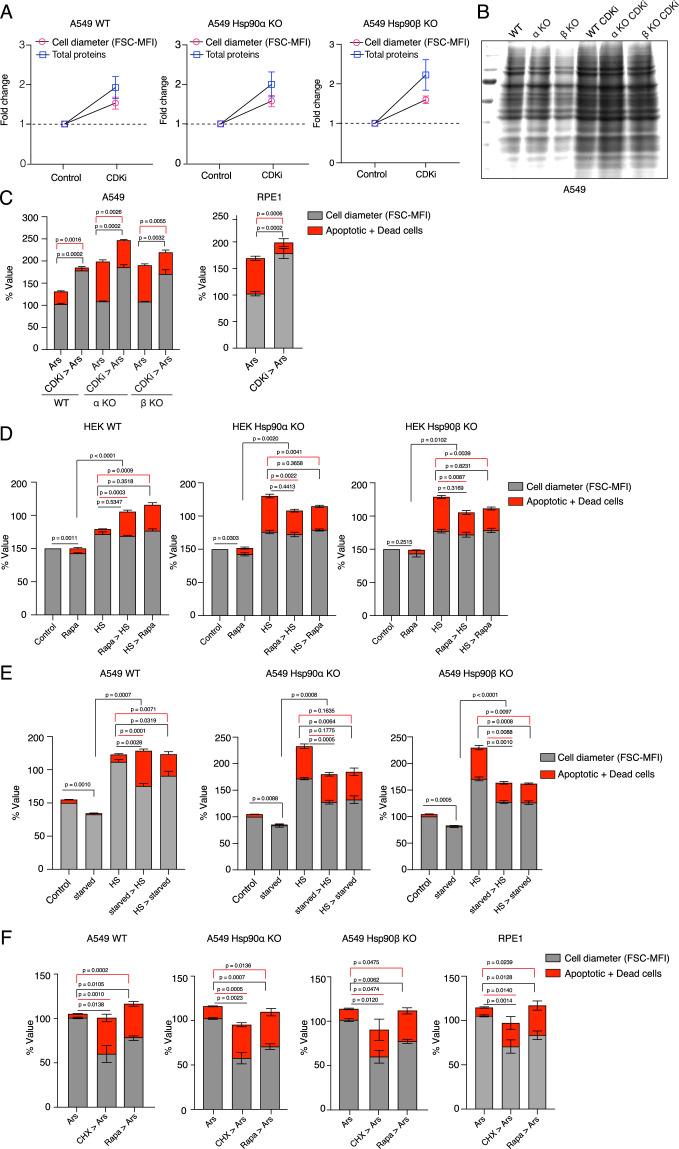
(A) Scheme of cell size enlargement or reduction experiments. CHX, cycloheximide; CDKi, CDK4/6 inhibitor. (B) Cell size was first enlarged by treating cells with 100 nM CDKi for 3 days; then, cells were washed and subjected to chronic HS at 40 °C for 3 more days (CDKi >HS). Cell size (% FSC-MFI; grey part of the bars) and cell death (% annexin V and PI-positive; red part of the bars) were measured by flow cytometry. The values for cell size and death in the different experimental conditions are normalized to the respective 37 °C controls (n=3 biologically independent experiments). (C) Cells were first pretreated with 7.5 nM rapamycin (Rapa) for 3 days to reduce the cell size. After that, the cells were subjected to chronic HS at 40 °C for 3 days (Rapa >HS). HS >Rapa, the two treatments were done the other way around. The cell size (% FSC-MFI) and relative cell death (% annexin V and PI-positive) were quantified by flow cytometry. The values for cell size and death in different experimental conditions are normalized to the respective 37 °C control (n=3 biologically independent experiments). (D) Scheme of experiments aimed at determining impact of limiting physical space on cell size increase. (E and F) Phase-contrast micrographs of RPE1 cells seeded in different numbers to restrict the space for cell size increase during adaptation to chronic HS (representative images of n=4 biologically independent experiments). The size bar in the top left panel indicates 100 µM. The cell size (% FSC-MFI) and relative cell death (% annexin V-PI positive) are quantified by flow cytometry. For the bar graphs, the values for cell size and death in different conditions are normalized to the low density (dns) cell population at 37 °C day 0 (n=4 biologically independent experiments). The data are represented as mean values ± SEM for all bar graphs. The statistical significance between the groups was analyzed by two-tailed unpaired Student’s t-tests.


