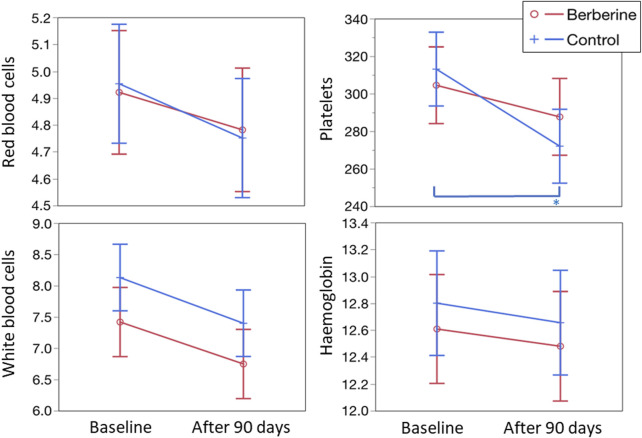
FIGURE 5.
Evaluation of the main blood parameters. Values for red blood cells and platelets are expressed as 109/L; values for white blood cells are expressed as 1012/L; values for haemoglobin are expressed as g/L. For all four parameters shown in the figure and for the haematocrit value (data not shown), no statistically significant differences, both between groups and between times, were observed. For platelets, the control group showed a significant decrease (p < 0.0005, see asterisk) at 3 months versus baseline.

