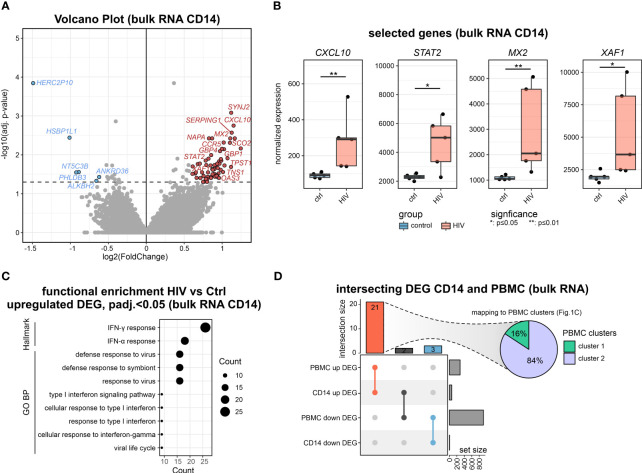
Figure 2.
Bulk transcriptomics of monocytes in PLHIV mainly reveals IFN-signaling (A) Volcano plot showing the DEGs (adj. p.val<0.05, |FC|>1.5) in HIV vs. control of bulk CD14+ monocyte transcriptomes. (B) Boxplot and whisker of selected HIV-specific genes. Wilcoxon rank-sum for statistical testing (*: p-value <0.05, **: p-value <0.01). (C) Functional enrichment using the GO and Hallmark databases upregulated DEG (HIV vs Ctrl). (D) Intersecting DEG for the comparison of HIV vs Ctrl in bulk transcriptomes from CD14+ monocytes and PBMCs. Commonly upregulated DEG mapped to PBMC clusters from Figure 1C.

