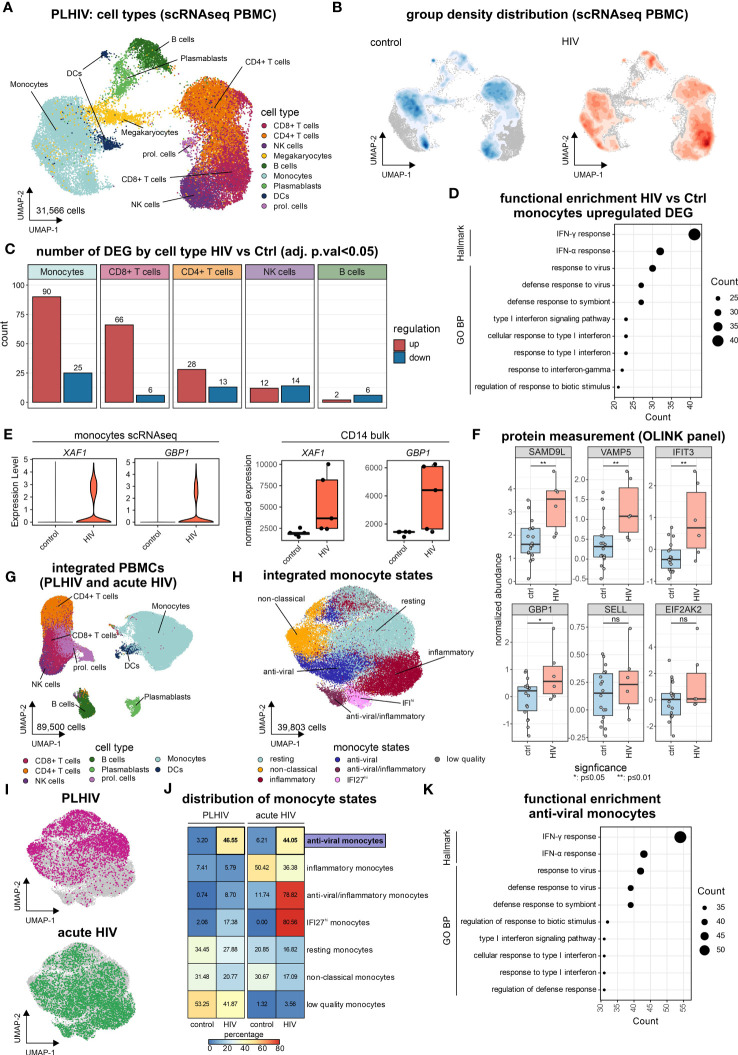
Figure 3.
“Anti-viral” monocyte state is persistent in PLHIV (A) UMAP of PBMCs from PLHIV patients (n= 31,566 cells) indicating identified cell types. (B) UMAP from (A) colored by disease group density distribution. (C) Number of DEG (adj. p.val<0.05, |log2FC|>0.25, min.pct=0.1) by major cell types for the comparison HIV vs Ctrl. (D) Functional enrichment using the GO and Hallmark databases for HIV-specific (up-regulated) genes in monocytes. (E) Marker expression of XAF1 and GBP1 by disease group for monocytes extracted from scRNA-seq data (left panel) and bulk CD14+ monocytes (right panel). (F) Protein level quantification for SAMD9L, VAMP5, IFIT3, GBP1, SELL, and EIF2AK2 using the Olink system. Wilcoxon rank-sum for statistical testing (ns: not significant, *: p-value <0.05, **: p-value <0.01). (G) UMAP of integrated PBMCs from PLHIV (A) and acute HIV (Kazer et al., n= 59,286 cells) for commonly present cell types in both datasets, identified cell types are indicated (total dataset n= 89,500 cells). (H) UMAP of integrated monocyte subset (n= 39,803 cells) from PLHIV and acute HIV annotated by signatures from Kazer et al. and cluster marker expression. (I) UMAP of integrated monocytes colored by dataset origin (PLHIV and acute HIV), each n= 10,000 cells. (J) Confusion matrix heatmap showing the distribution of monocyte cell states for disease groups stratified by dataset. (K) Functional enrichment using the GO and Hallmark databases for markers (from Figure S3E) of the ‘anti-viral’ monocyte state.

