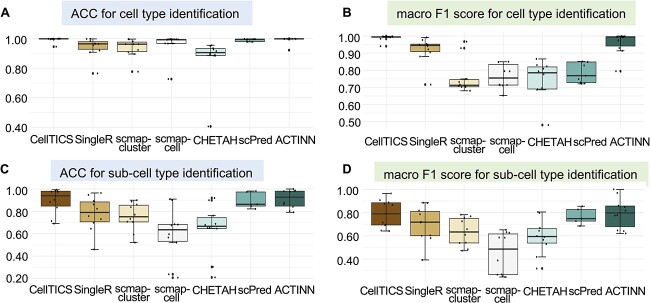
Figure 2.
The prediction performance of CellTICS and other cell-type identification methods. A total of 10 analysis tasks were conducted to generate the boxplots. In each of these tasks, the average ACC and macro F1 scores based on five analysis repeats were used. (A) The ACC for cell-type identification. (B) The macro F1 score for cell-type identification. (C) The ACC for sub-cell-type identification. (D) The macro F1 score for sub-cell-type identification.

