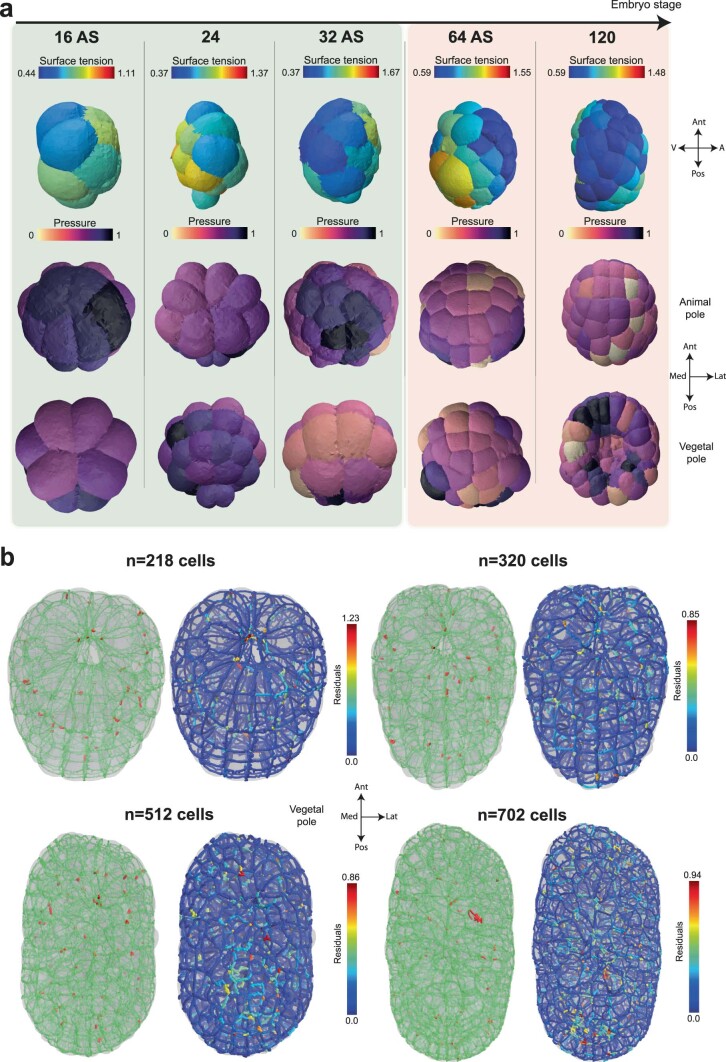
Extended Data Fig. 4. Additional validation data of the 3D tension inference.
a) Mitotic softening and stiffening in the 16AS, 24, 32AS, 64 and 120 cell stages of the early ascidian embryo (P. mammillata). Upper row: sagittal view of inferred apical tension. Middle and bottow rows: animal and vegetal views of the inferred cell pressures. The ratio of mitotic to interphase apical tension is colored green if it is less than 1 and red if it is greater than 1. The orientation of the embryo is given by arrows Ant: anterior, Pos: posterior, Med: medial, Lat: lateral, V: vegetal, A: animal. b) Vegetal view of stable (green) and unstable (red) junctions (Left) and tension inference 512 and 702 cell stages. The orientation of the embryo is given by arrows Ant: anterior, Pos: posterior, Med: medial, Lat: lateral.

