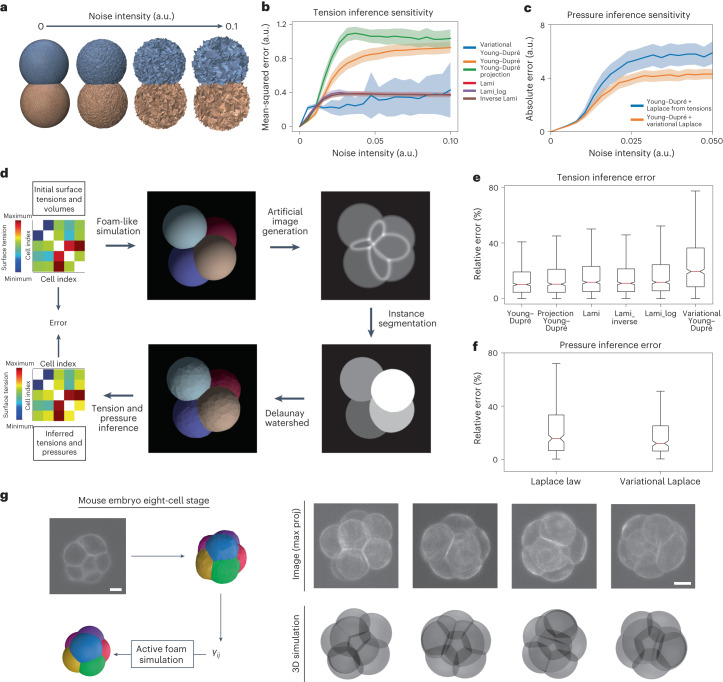
Fig. 3. In silico validation of the force-inference pipeline.
a, Sensitivity analysis of different formulas for tension and pressure inference. Foam-like simulation meshes are perturbed by randomly displacing each vertex position following a uniform law. b, Plot of the mean squared error on inferred tensions (mean ± s.d.) as a function of the intensity of the noise for the different tension formulas (n = 54 simulated embryos with 2 to 11 cells). c, Plot of the absolute error (mean ± s.d.) on the inferred pressure as a function of the noise intensity for the Laplace and variational Laplace formulas (n = 54 simulated embryos). d, Pipeline for benchmarking force inference: from random surface tensions (visualized here as a symmetrical (nc + 1) × (nc + 1) matrix) and cell volume values, foam-like embryo meshes are simulated, from which artificial microscopy images are generated; then, our end-to-end pipeline is applied to regenerate a mesh and infer tension and pressure values. Min, minimum and Max, maximum. e, Plot of the relative error in the inferred tensions for the different tension inference formulas applied to our simulated embryo dataset (n = 54 simulated embryos; the red center line denotes the median value, while the box contains the 25th to 75th percentiles of the dataset; the whiskers mark the 5th and 95th percentiles). f, Relative errors on inferred pressures on our simulated embryo dataset with Laplace and variational Laplace formulas (n = 54 simulated embryos; the red center line denotes the median value, while the box contains the 25th to 75th percentiles of the dataset; the whiskers mark the 5th and 95th percentiles). g, Self-consistent validation of the inference on the compaction of the eight-cell mouse embryo. Surface tensions are inferred with the pipeline and averaged between the cell–medium and cell–cell interfaces. Foam-like simulations are performed using these tensions and yield an in silico embryo morphology that is compared to the real embryo image. Scale bars, 20 μm.

