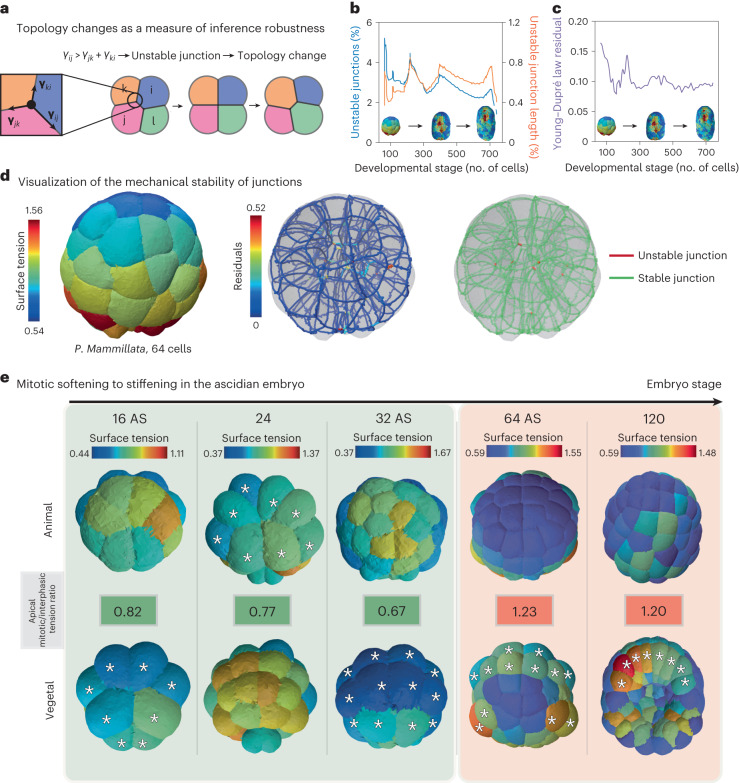
Fig. 4. In vivo validation of the 3D tension inference.
a, Illustration of the process of T1 topological transition when one tension at a junction becomes greater than the sum of the two others. b, Plot of the percentage of unstable junctions in the embryo (blue) and the ratio of unstable junction length to total junction length in the embryo as a function of its development stage, defined by its number of cells. c, Plot of the mean residual of Young–Dupré equations (purple) in the embryo as a function of its development stage, defined by its number of cells. d, The left shows the surface tension map of the 64-cell ascidian embryo. The middle shows a visualization of the residuals of Young–Dupré equations for each junction in the same embryo. The right shows the junctions for which inference predicts a T1 topological transition are mechanically unstable. Visualization of stable (green) and unstable (red) junctions in a 64-cell ascidian embryo (P. mammillata). e, Maps of apical tension at the animal and vegetal poles of the early ascidian embryo (P. mammillata) in the 16AS (AS for asynchronous), 24-, 32AS, 64- and 120-cell stages. The ratio of mitotic to interphase apical tension is colored green if it is less than one and red if it is greater than one. Mitotic cells are indicated with a white star.

