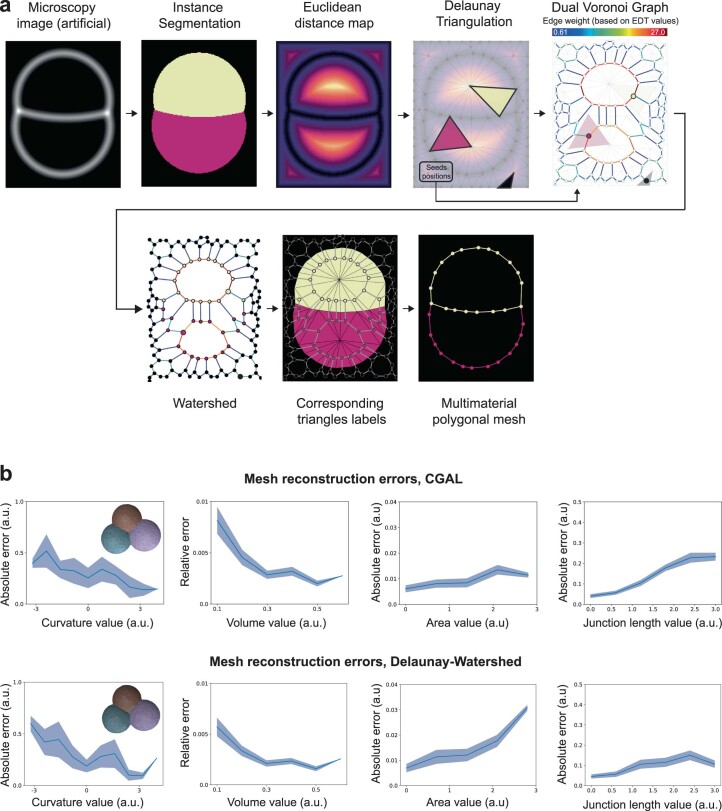
Extended Data Fig. 1. Detailed procedure and benchmarking of the Delaunay-watershed mesh generation algorithm.
a) Pipeline for mesh generation from a microscopy image (here in 2D for graphical purposes). From the Delaunay triangulation of the image domain, we construct a graph of the dual Voronoi diagram. The edge weights of this graph are computed by integrating the value of the Euclidean distance map along corresponding edges that separates two triangles in the primary domain. The watershed is performed on the dual graph, and the seeds are chosen by taking the triangles containing the pixel with the highest EDT value in the primary domain. b) Comparison of the geometric error (mean ± SD) obtained on interface curvatures, cell volumes, interface areas, and junctional lengths between CGAL and our Delaunay-watershed algorithms for mesh reconstruction (n=54 simulated embryos).

