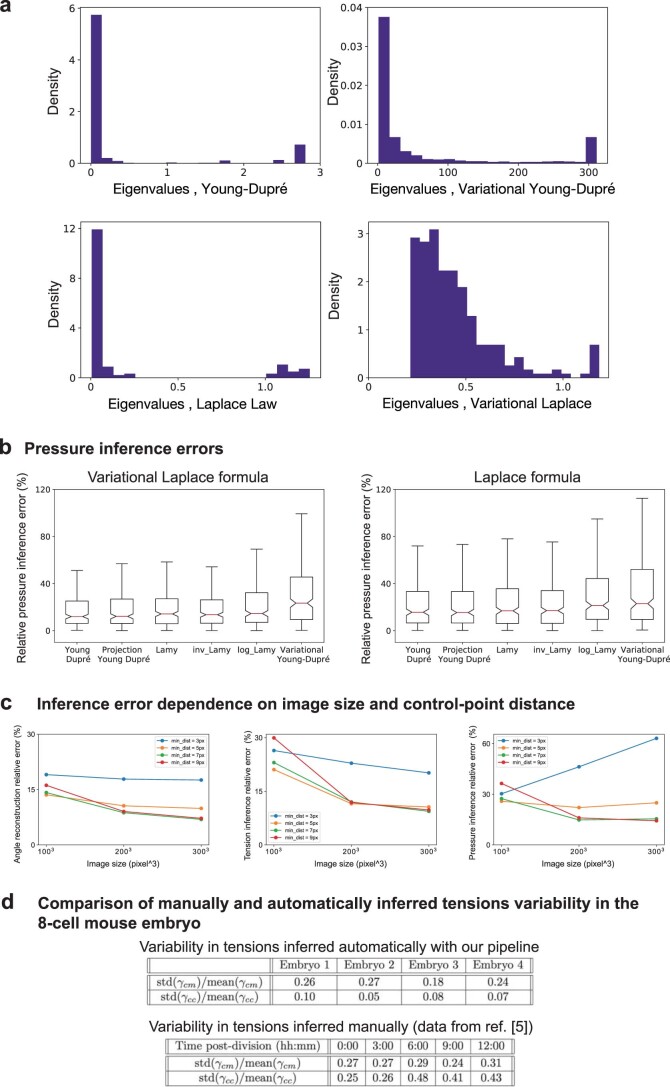
Extended Data Fig. 3. Inference sensitivity and influence of tensions formulas for pressure inference.
a) Histogram of eigenvalues of the pseudo-inverse matrices used to infer tensions and pres- sures for the Young–Dupré, variational Young-Dupré, Laplace and Variational Laplace formulas, on our simulated embryo dataset. The spread of the histogram is a measure of the conditioning of the matrix. b) Comparison of the relative error on inferred pressures obtained on our simulated embryo dataset between Laplace and variational Laplace formulas (n=54 simulated embryos; the red center line denotes the median value, while the box contains the 25th to 75th percentiles of dataset; the whiskers mark the 5th and 95th percentiles). c) Mean relative error on angles reconstruction (left), tension inference (mid- dle) and pressure inference (right), depending on the refinement of the mesh (in pixels) and the image size. d) Comparison of the variability (SD/mean) in tensions measured manually (from5) and inferred automatically with our pipeline in the 8-cell mouse.

