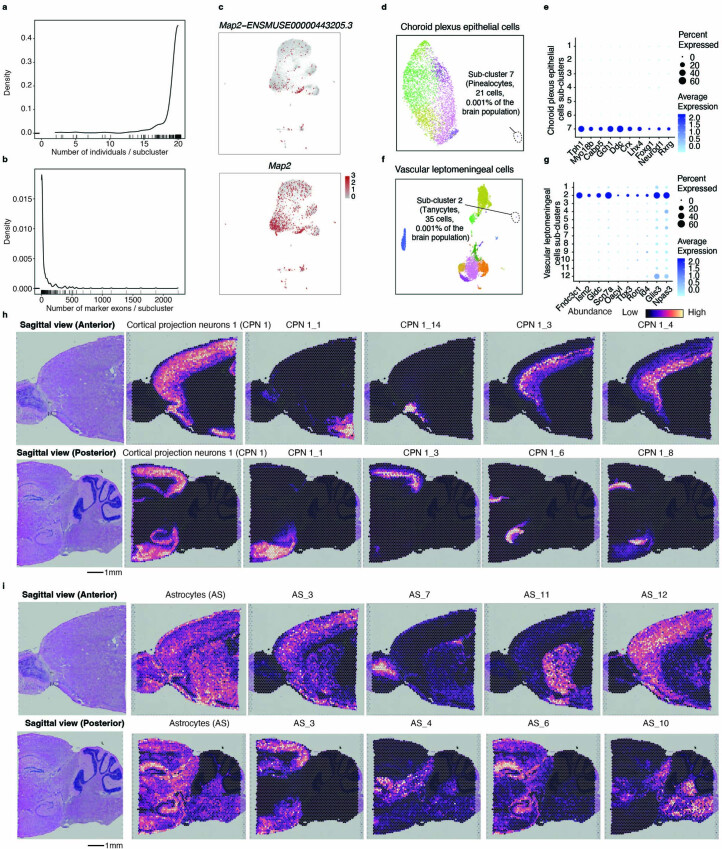
Extended Data Fig. 5. Characterizations of cellular subtypes in the mouse brain.
a. Density plot showing the number of individuals per subcluster. The rug plot below the density plot represents the individual subclusters. b. Density plot of the number of marker exons per subcluster. The rug plot below the density plot represents the individual subclusters. c. UMAP plots, same as Fig. 2a based on both gene and exon-level expression, showing the specific expression of an example exon marker Map2-ENSMUSE00000443205.3 (top) of microglia subcluster 8 and the lack of specificity of its corresponding gene Map2 (bottom). Single-cell gene/exon expression was normalized first by library size, log-transformed, and then scaled to Z-scores. d. UMAP visualizations showing subclustering analysis for choroid plexus epithelial cells colored by subcluster IDs, highlighting the rare subcluster shown in Fig. 2c. e. Dot plot showing the expression of selected marker genes for choroid plexus epithelial cells-7, including both normal genes (left five genes) and transcription factors (right five genes). f. UMAP visualizations showing subclustering analysis for vascular leptomeningeal cells colored by subcluster IDs, highlighting the rare subclusters shown in Fig. 2c. g. Dot plot showing the expression of selected marker genes for vascular leptomeningeal cells-2, including both normal genes (left five genes) and transcription factors (right five genes). h-i. Mouse brain sagittal sections showing spatial abundances of main cell types and related subclusters for cortical projection neurons 1 (h) and astrocytes (i) in anterior (top) and posterior (bottom) regions, estimated using the cell2location27.

