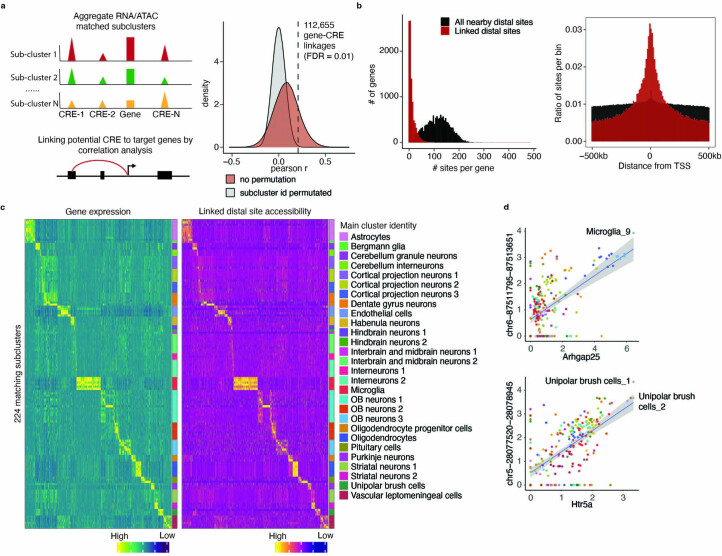
Extended Data Fig. 6. Cis-regulatory elements regulation of gene expression at the subcluster level.
a. Overview of analytical steps (left) and density plot showing the distribution of Pearson correlation coefficients between gene expression and the accessibility of distal linked site (colored in red) or all nearby accessible elements (within ±500 kb of the promoter, colored in gray) across pseudo-cells. Dash line indicates the Pearson correlation coefficient cutoff with 0.01 FDR. b. Left, histogram showing the number of accessible sites per gene. Right, histogram shows the distance distribution of accessible sites within 500 kb of genes. Both plots include all nearby accessible sites (colored in black) and the linked accessible sites (colored in red). c. Heatmaps showing the concordant expression of genes (left) and accessibility of putative distal linked sites (right) across all matched subclusters. Rows represent the aggregated gene expression or peak accessibility for a given subcluster. The raw aggregated RNA-seq and ATAC-seq data was normalized first by the total number of reads for each subcluster and then scaled to Z-score across all subtypes. d. Correlation plot showing examples of subcluster-specific genes and linked accessible sites for microglia-9 and unipolar brush cells-2. Gray area indicates 95% confidence intervals around the linear regression line.

