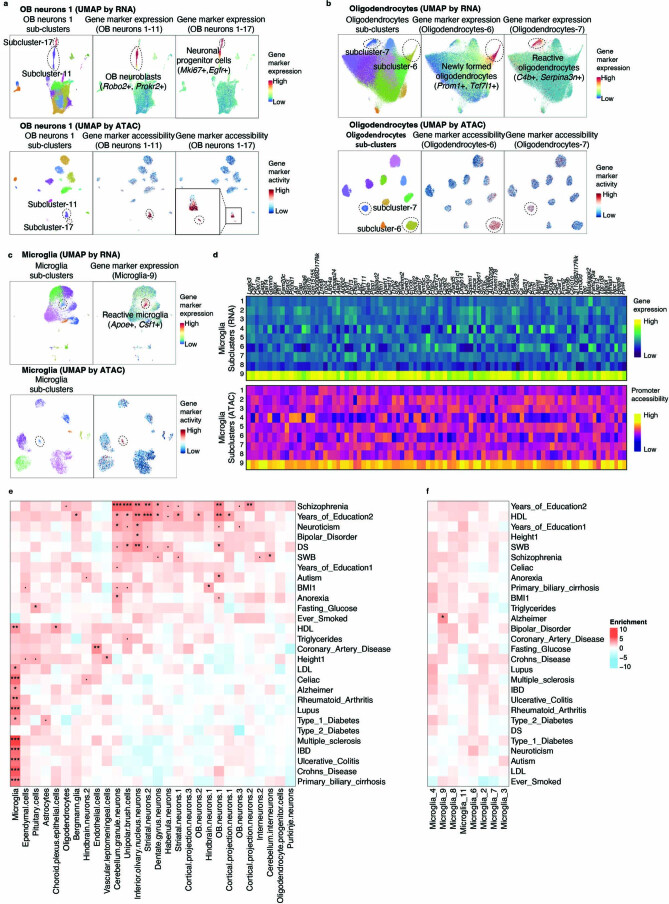
Extended Data Fig. 8. Identifying aging-associated subclusters in EasySci-ATAC and cell-type-specific enrichment of GWAS heritability of human phenotypes.
a. UMAP visualization showing OB neurons 1-11 and OB neurons 1-17 identified from EasySci-RNA (top) and EasySci-ATAC (bottom), colored by subcluster id (left), aggregated gene expression or gene activity of OB neurons 1-11 gene markers (middle) and OB neurons 1-17 gene markers (right). b. UMAP visualization showing oligodendrocytes-6 and oligodendrocytes-7 identified from EasySci-RNA (top) and EasySci-ATAC (bottom), colored by subcluster id (left), aggregated gene expression or gene activity of oligodendrocytes-6 gene markers (middle) and oligodendrocytes-7 markers (right). c. UMAP visualization showing microglia-9 identified from EasySci-RNA (top) and EasySci-ATAC (bottom), colored by subcluster id (left), aggregated gene expression or gene activity of microglia-9 gene markers (right). Subcluster marker genes were identified by differential expression analysis using scRNA-seq data (Methods). d. Heatmap showing the gene expression (top) and the promoter accessibility (bottom) of microglia-9 enriched genes across subclusters. The EasySci-RNA data (UMI count matrix) and EasySci-ATAC data (read count matrix) were aggregated per subcluster, normalized by the total number of reads, column centered, and scaled. Of note, rare subclusters from RNA-seq data that were not detected in ATAC-seq data were not included in this analysis. e-f. Heatmap showing the results of LDSC analysis of the SNPs associated with the indicated phenotypes in DEpeaks across main cell types (e) or across microglia subtypes (f), colored by z score of regression coefficient. *FDR < 0.05, **FDR < 0.01, ***FDR < 0.001. Only cell types that contain DEpeaks from all autosomes are included in this analysis.

