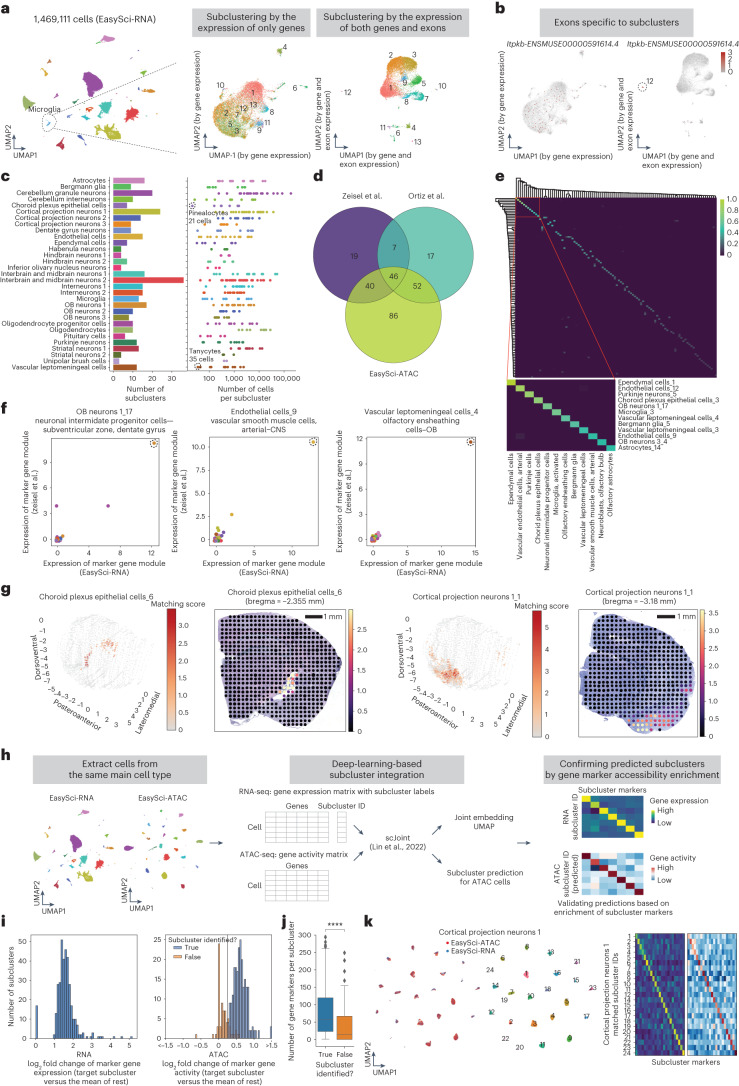
Fig. 2. Identification of cellular subtypes in the mouse brain.
a, Example UMAPs of microglia cells subjected to subclustering analysis based on gene expression alone (middle) or both gene and exon expression (right), colored by subcluster ID derived from combined gene and exon information. b, UMAP plots same as a, showing the expression of an exonic marker Itpkb-ENSMUSE00000591614.4 of microglia subcluster 12. c, For each main cell type, bar plot showing the number of subclusters (left) and dot plot showing the number of cells from each subcluster (right). Two rare subclusters (choroid plexus epithelial cells-7 and vascular leptomeningeal cells-2) are circled. d, Venn diagram showing the number of validated subclusters using integration analysis with Zeisel et al.2, Ortiz et al.28 or the EasySci-ATAC dataset. e, Heatmap illustrating the similarity score between cell types derived from EasySci (rows) and Zeisel et al.2 (columns), colored by the min-max normalized beta values obtained from cell-type correlation analysis (Methods). f, Dot plot showing the expression of example GMs unique to subclusters across paired cell types between the EasySci dataset and Zeisel et al.2, colored by main cell types (same as Fig. 2c). g, Spatial distributions of example subclusters, inferred using a brain spatial transcriptomics atlas28 and the cell2location approach27, colored by matching score. h, Scheme outlining scRNA and scATAC integration analyses. i, Histogram showing the log2 fold change of marker gene expression from RNA-seq (left) and marker gene activity from ATAC-seq (right) per subcluster compared to the rest of cells. Predicted subclusters with log2 fold change of gene activity > 0.25 between the target subcluster and the rest of cells and contain more than 10 cells are considered matched. j, Box plots illustrate the number of markers comparing the subclusters that could be validated in ATAC-seq data (n = 224 subclusters) to those that could not (n = 135 subclusters). Two-sided Wilcoxon rank-sum test was used. ****, P < 0.0001 (P = 7.8 × 10⁻⁸). k, Example subcluster integration results of cortical projection neurons 1. Left: UMAP plots demonstrating the overlap of two molecular layers, color-coded by subcluster ID Right: heatmaps showing the enrichment of gene activity and gene accessibility of matching subclusters.

