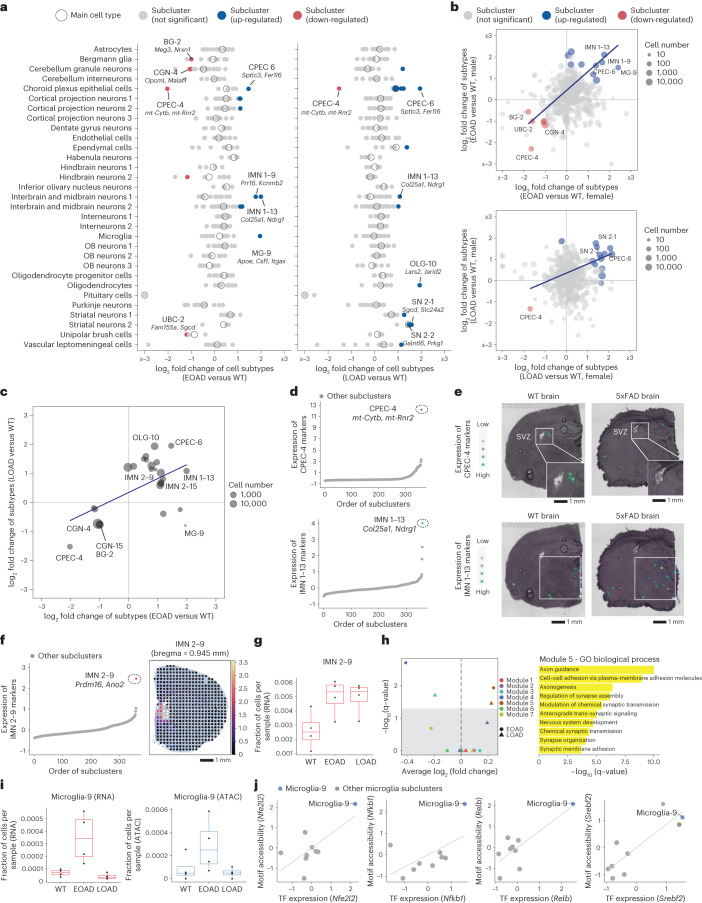
Fig. 4. Identifying AD pathogenesis-associated cell subtypes.
a, Dot plots showing the log-transformed fold changes of main cell types (circles) and subclusters (dots) comparing EOAD versus WT (left) and LOAD versus WT (right). Significantly changed subclusters were colored by the direction of changes. Representative subclusters were labeled along with top gene markers. b, Scatter plots showing the correlation of the log fold change of subclusters (top: EOAD versus WT; bottom: LOAD versus WT) between males and females. c, Scatter plot showing the correlation of the log fold change of subclusters in two AD models (both compared with the WT). Only subclusters with significant changes in at least one AD model are included. Black/gray reflects overlapping dots. d, Scatter plots showing the aggregated expression of gene markers of two cell subtypes (top: CPEC-4; bottom: the IMN 1–13) across all subclusters from EasySci-RNA data. e, Brain coronal sections showing the spatial expression of subtype-specific gene markers of two subtypes (top: CPEC-4; bottom: the IMN 1–13) in the WT and EOAD brains in 10x Visium data. f, Scatter plot showing the aggregated expression of gene markers of IMN 2–9 across all subclusters from EasySci-RNA data (left) and the mapping score per pixels of the IMN 2–9 subcluster cells on the bregma 0.945 mm coronal section highlighting the lateral septal nucleus region28 (right). g, Box plots showing the fraction of IMN 2–9 cells across conditions (WT: n = 4 mice, EOAD: n = 4 mice, LOAD: n = 4 mice) profiled by EasySci-RNA. h, GM expression differences in both AD models against WT control (left) and the top enriched Gene Ontology (GO) biological processes pathways of module 5 genes (right). i, Box plots showing the fraction of microglia-9 cells across conditions (WT: n = 4 mice, EOAD: n = 4 mice, LOAD: n = 4 mice) profiled by EasySci-RNA (left) or EasySci-ATAC (right). j, Scatter plot showing the correlated gene expression and motif accessibility of four TFs enriched in microglia-9, together with a linear regression line. Boxes in box plots indicate the median and IQR with whiskers indicating 1.5× IQR.

