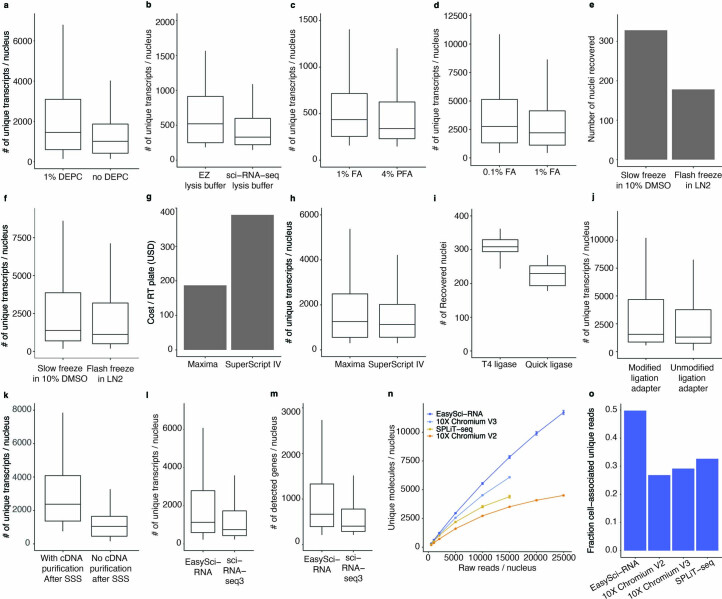
Extended Data Fig. 1. Representative examples showing the performance of optimized conditions of EasySci-RNA.
a-b. Box plots showing the number of UMIs per nucleus lysed with 1% DEPC (n = 1,596 cells) vs. no DEPC (n = 3,036 cells) in lysis buffer (a); or EZ lysis buffer (n = 50 cells) vs. sciRNA-seq3 nuclei lysis buffer (n = 96 cells)11 (b). c-d. Box plot showing the number of UMIs detected per nucleus across fixation conditions: 1% formaldehyde (n = 403 cells) vs 4% paraformaldehyde (n = 358 cells) (c); 0.1% formaldehyde (n = 2,952 cells) vs. 1% formaldehyde (n = 2,211 cells) (d). e-f. Slow freezing condition in 10% DMSO (n = 328 cells) outperformed the flash freezing condition (n = 178 cells) by increasing the number of nuclei recovered (e) and the number of UMIs per nucleus (f). g-h. Maxima reverse transcriptase (n = 5,197 cells) reduces the enzyme cost (g) without affecting the number of transcripts detected per nucleus compared to SuperScript™ IV reverse transcriptase (n = 4,071 cells) for profiling mouse brain cells (h). i. EasySci-RNA used T4 ligase (n = 40 wells) instead of quick ligase (n = 16 wells) for a higher recovery rate of nuclei. j. Box plot showing the number of unique transcripts detected per nucleus comparing chemically modified ligation primers (n = 499 cells) to unmodified adapters (n = 499 cells). k. Additional cDNA purification step after second strand synthesis (n = 90 cells) increased the number of unique transcripts per nucleus compared to without cDNA purification (n = 90 cells). l-m. Comparison of the number of unique transcripts and genes in EasySci-RNA (n = 11,501 cells) and sciRNA-seq3 (n = 117 cells) with the same sequencing depth ( ~ 2,500 reads/cell) n. Line plots showing the median number (with standard error) of unique transcripts per nucleus from a deep sequenced small-scale EasySci-RNA, a 10X V2 library83, a 10X V3 library and a SPLiT-seq library33, all profiling mouse brains (Methods). o. Comparison of the fraction of cell-associated unique transcripts from the total number of raw reads across different techniques at the same sequencing depth ( ~ 3,800 raw reads/cell). Boxes in box plots indicate the median and interquartile range (IQR) with whiskers indicating 1.5X IQR.

