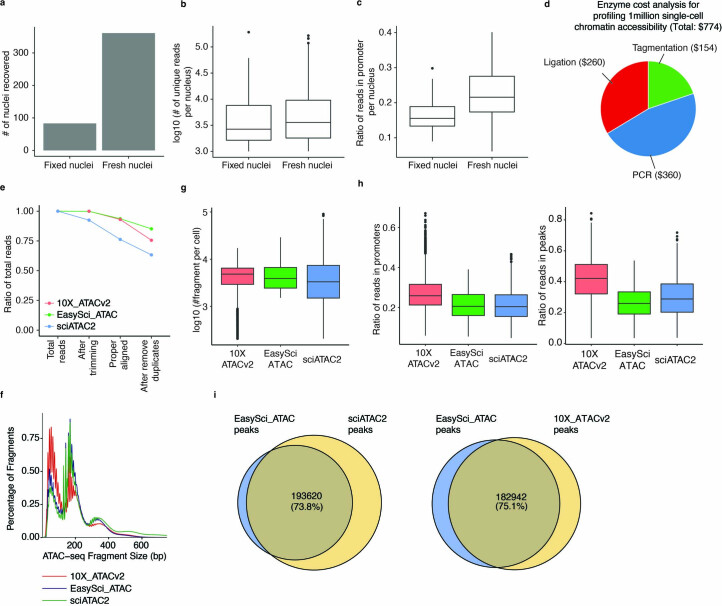
Extended Data Fig. 2. Representative examples showing the performance of optimized conditions of EasySci-ATAC and quality comparison with other single-cell ATAC protocols.
a-c. We compared two fixation conditions: nuclei were either fixed with 1% formaldehyde for 10 minutes at room temperature (n = 63 nuclei) or directly used for tagmentation without fixation (n = 361 nuclei). The unfixed condition outperformed the fixed condition by increasing cell recovery (a), the number of reads (b), and the ratio of reads in promoters (c) per nucleus. d. Pie chart showing the estimated enzyme cost compositions of library preparation for profiling 1 million single-cell chromatin accessibility profiles using EasySci-ATAC. e. Lineplot showing the ratio of reads loss during each data processing step comparing EasySci-ATAC, 10X-ATACv2 and sci-ATAC-seq (referred as ‘sciATAC2’ in the figure). f. Histogram showing the fragment length distributions across EasySci-ATAC, 10X-ATACv2 and sci-ATAC-seq. g. Box plot showing the number of unique fragments comparing EasySci-ATAC (n = 3,636 cells), 10X-ATACv2 (n = 6,489 cells) and sci-ATAC-seq (n = 5,494 cells). h. Box plots showing the number of reads mapped to promoters (left, defined as ±1 kb around TSS) and peaks (right) comparing EasySci-ATAC (n = 3,636 cells), 10X-ATACv2 (n = 6,489 cells) and sci-ATAC-seq (n = 5,494 cells). Peak calling was performed on each dataset separately and peaks were merged to a union peak set. i. Pieplot showing the number of peaks that can be repeatedly identified between EasySci-ATAC and sci-ATAC-seq (left) and between EasySci-ATAC and 10X-ATACv2 (right). Boxes in box plots indicate the median and interquartile range (IQR) with whiskers indicating 1.5X IQR.

