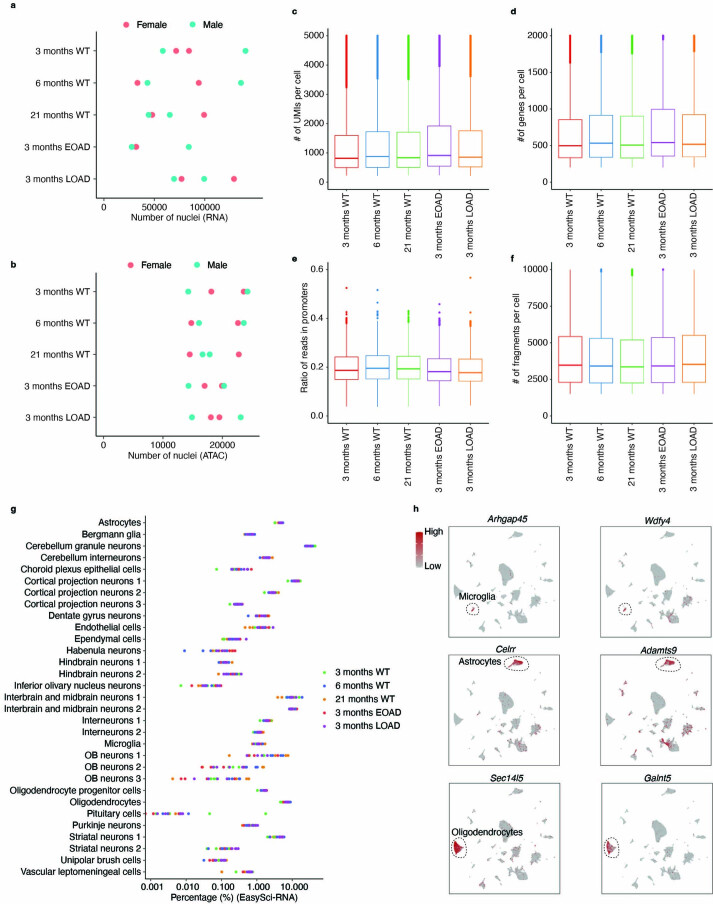
Extended Data Fig. 3. Performance of EasySci-RNA/ATAC profiling of mouse brain samples and identification of main brain cell types and cell-type-specific markers by EasySci-RNA.
a-b. Scatter plots showing the number of single-cell transcriptomes (a) and single-cell chromatin accessibility (b) profiled in each mouse individual across five conditions, colored by sex. c-d. Box plots showing the number of unique transcripts (c) and genes (d) detected per nucleus in each condition profiled by EasySci-RNA (3-month WT: n = 354,842 cells, 6-month WT: n = 306,537 cells, 21-month WT: n = 257,017 cells, 3-month EOAD: n = 175,673 cells, 3-month LOAD: n = 375,042 cells). e-f. Box plots showing the ratio of reads in promoters (e) and the number of unique fragments (f) per cell in each condition profiled by EasySci-ATAC (3-month WT: n = 80,259 cells, 6-month WT: n = 77,101 cells, 21-month WT: n = 71,841 cells, 3-month EOAD: n = 71,548 cells, 3-month LOAD: n = 75,560 cells). g. The recovered cell percentage from every main cell type is shown across different replicates. The samples are color-coded based on the condition of origin. h. UMAP plots showing the gene expression of identified novel markers for microglia (Arhgap45, Wdfy4), astrocytes (Clerr, Adamts9), and oligodendrocytes (Sec14l5, Galnt5). UMI counts for these genes are scaled by the library size, log-transformed, and then mapped to Z-scores. For all box plots, boxes indicate the median and interquartile range (IQR) with whiskers indicating 1.5X IQR.

