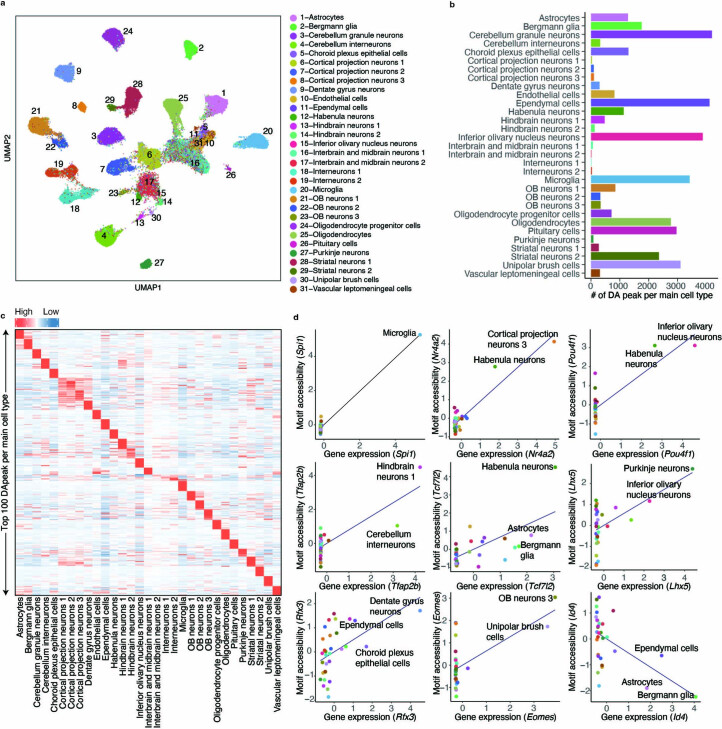
Extended Data Fig. 4. Characterization of cell-type-specific chromatin accessibility and key TF regulators using EasySci-ATAC.
a. UMAP plot of the EasySci-ATAC dataset subsampled to 5,000 cells per cell type (or all cells if the number of cells is less than 5,000), colored by main cell types in Fig. 1h. The analysis used the peak-count matrix without integration with the EasySci-RNA dataset. b. Bar plot showing the number of cell-type-specific peaks for each main cell type (defined as differential accessible (DA) peaks across main cell types with q-value < 0.05 and TPM > 20 in the target cell type). c. Heatmap showing the aggregated accessibility of top 100 DA peaks per cell type (ranked by fold change between the maximum and the second accessible cell type). Unique counts for cell-type-specific peaks are first aggregated, normalized by the library size, and then mapped to Z-scores. d. Scatter plots showing the correlation between gene expression and motif accessibility of cell-type-specific TF regulators, together with a linear regression line. TF gene expressions are calculated by aggregating scRNA-seq gene counts for each main cluster, normalized by the library size, and then mapped to Z-scores. TF motif accessibilities are quantified by chromVar101, then aggregated per main cell type and mapped to Z-scores (Methods).

