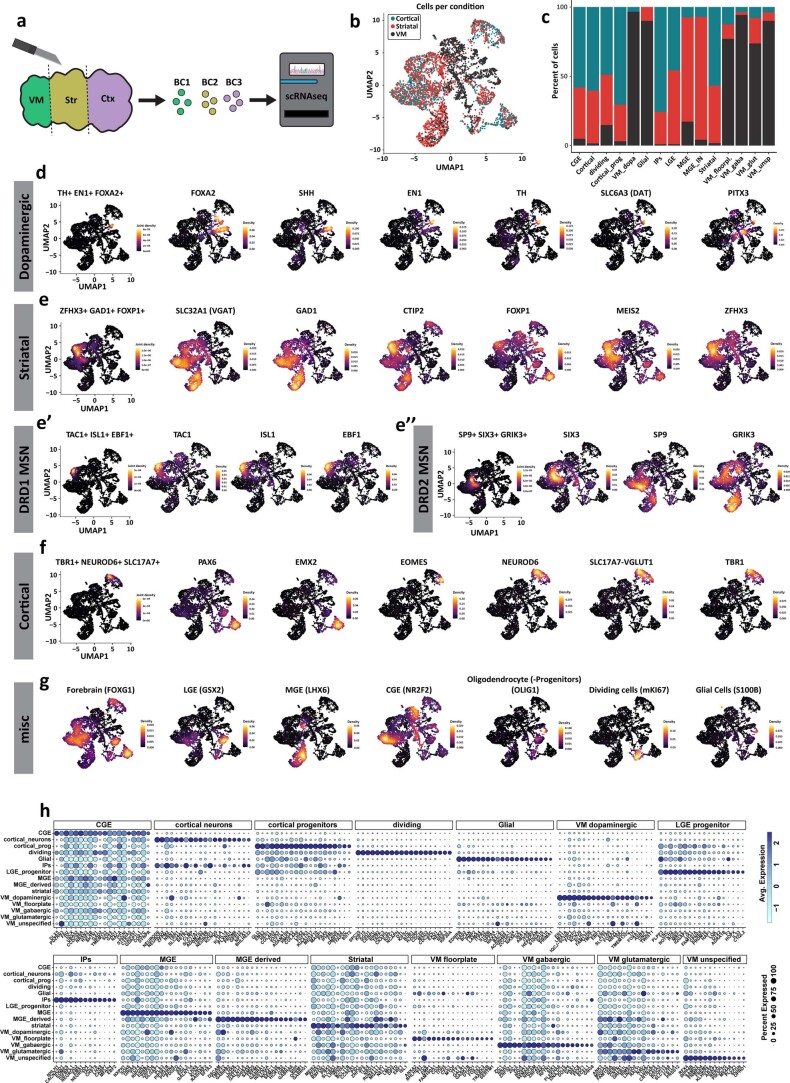
Extended Data Fig. 6. scRNA-seq confirms neuronal populations associated with the dopaminergic system in MISCOs.
a, Schematic for barcoding of VM, striatum and cortex tissue for droplet based scRNA-seq using MULTI-seq. b, Plotting of UMAP with indication of tissue origin. c, Stacked bar plot showing barcode origin of clusters in percent. d, Density plots of floor plate (FOXA2, SHH) and dopaminergic neuron (EN1, TH, DAT, PITX3) as well as a TH, EN1 and FOXA2 joint density plot indicate mDA neuronal cluster identity. e, The striatal neuron cluster is GABAergic (VGAT, GAD1) and is positive for the striatal markers CTIP2, FOXP1, MEIS2 and ZFHX3. The joint density plot of ZFHX3, GAD1 and FOX1 indicates striatal neuron cluster identity. e’-e”, The striatal cluster expresses markers of DRD1 medium spiny neurons (e’, TAC1, ISL1, EBF1) as well as DRD2 medium spiny neurons (e”, SIX3, SP9, GRIK3). f, Density plots for cortical progenitor markers (PAX6, EMX2), the intermediate progenitor marker EOMES and the cortical neuronal markers NEUROD6, VGLUT1 and TBR1. g, Forebrain (cortical and GE patterned) clusters express the forebrain marker FOXG1. Clusters for LGE progenitors (GSX2) as well as MGE (LHX6) and CGE-derived (NR2F2) cells were observable. Additionally, clusters with the identities of oligodendrocyte (-progenitors) (OLIG1), dividing progenitors (mKI67) and glial cells (S100B) clusters were present. h, Dot plot of top marker genes expressed in at least 20% of cells in individual clusters ranked by p value, calculated by presto implementation of the Wilcoxon rank sum test and auROC analysis.

